A few diabetes papers of interest
“Continuous subcutaneous insulin infusion, or insulin pump, therapy for individuals with type 1 diabetes has increased gradually since the 1980s. Yet, a Cochrane review concluded in 2010 that although some evidence indicates that insulin pumps improve glycemic control compared with standard multiple daily injection (MDI) therapy, insufficient evidence exists regarding mortality, morbidity, and costs (1). A systematic review of cost-effectiveness studies summarized comparisons of insulin pump and MDI therapy using model analyses to describe the expected impact on long-term costs, development of complications, and quality of life (2). Five of the studies reported long-term discounted incremental costs of insulin pumps of $20,000–$40,000, whereas two studies reported lower and one higher additional costs for insulin pump therapy. However, real-world data on health care and societal costs of insulin pump therapy compared with MDI therapy are scarce. […] Data from the Swedish National Diabetes Register (NDR) have shown a lower incidence of some cardiovascular events and all-cause mortality for individuals with type 1 diabetes on insulin pump therapy in 2005–2012 (5). Registration of insulin pump therapy started in 2002 in the NDR, and use of pump therapy among individuals with type 1 diabetes increased from 10% in 2002 to 22% in 2015 (6). A relevant research question from a health care planning perspective is whether real-world data match earlier model-based predictions for differences in resource use and costs. We investigated from a societal perspective costs of continuous insulin pump and MDI therapy in clinical practice for individuals with type 1 diabetes using the NDR and a 9-year observational panel from national health and socioeconomic data registers.”
“The final analysis set included data in 2005–2013 for 14,238 individuals with type 1 diabetes, of whom 4,991 had insulin pump therapy (598 individuals switched to pump therapy in 2005 or later after original inclusion as control subjects with MDI). We had 73,920 person-years of observation with a mean follow-up of 5 years per subject. […] The distribution of annual costs was left-skewed with a tail of observations with high costs, although the most person-years incurred costs corresponding to typical insulin therapy and up to two regular follow-up appointments […] The difference in the annual total cost between the therapy groups was $3,923 (95% CI $3,703–$4,143). […] The difference in annual medication costs, including disposables, was $3,600, indicating that they contributed significantly to overall annual cost differences. Pump users had more outpatient appointments (3.8 vs. 3.5 per year; P < 0.001) and were less likely to have person-years without use of outpatient or inpatient care (9% vs. 12% of person-years). Even with a median duration of diabetes of 21 years at baseline, the mean cost per patient-year of cardiovascular comorbidities and diabetic complications was low because of the overall low rates of events. […] Total annual costs increased with age for both insulin therapies, and pump therapy was associated with higher costs across age-groups. However, the cost increments for insulin pump therapy decreased with age (differences ranging from 56% for those 18–27 years of age to 44% for those ≥48 years [reference: MDI 18–27 years]). Total costs were higher for women but decreased with years of education and disposable income. […] The level of HbA1c at baseline affected the differences in average annual cost between study groups: the smallest difference ($2,300) was observed for individuals with HbA1c ≥8.6% (≥70 mmol/mol) and the greatest difference for individuals with HbA1c 6.5–8.5% (48–69 mmol/mol) at baseline [pump $12,824 vs. MDI $8,083; P < 0.001, US].”
“The study cohort was young (mean baseline age 34 years) with relatively few diabetic complications in both study groups. For instance, 1.5% of person-years had a cardiovascular event, and 5% had at least one health care contact with a cardiovascular diagnosis.
Observational studies provide a better indication of what is achieved in daily medical practice than randomized controlled studies (12). The strength of this observational study is the size and completeness of the study population, with virtually all adults with type 1 diabetes in Sweden included, longitudinal national register data, and a matching technique that accounts for time-variant variables, including diabetes duration, diabetes-related conditions and comorbidities, and demographic and socioeconomic factors. With the use of time-varying propensity scores, we allowed selected MDI control subjects to switch to pump therapy rather than to condition their eligibility or noneligibility on a future therapeutic change. The plentiful data allowed us to match two control subjects to each pump user to account for the variance in cost variables and enabled extensive subgroup and sensitivity analyses.”
“We observed only a few deaths (n = 353 [2.5% main analysis sample], no difference pump vs. MDI [OR 0.98 (95% CI 0.79–1.23)]) and similar rates of cardiovascular disease for pump and MDI in this study, except for borderline significantly fewer events with angina in the pump group. A heterogeneous distribution of events was found across nontreatment characteristics: ∼70% of all cardiovascular events occurred among individuals 48 years of age or older, and >90% of the events occurred among individuals with diabetes duration ≥20 years at baseline.
A lack of comparable calculations of total costs of diabetes treatment has been published to date, but cost-effectiveness studies of pump and MDI therapy have predicted long-term costs for the two treatment methods. Roze et al. (2) performed a meta-review of model-based studies that compared pump therapy and MDI, concluding that pump therapy can be cost effective. Published models have identified change in HbA1c and reduction in number of hypoglycemic events as important drivers of costs. A Swedish health technology assessment review in 2013 did not find evidence for differences in severe hypoglycemia between pump therapy and MDI but identified indications of lower HbA1c (13). […] Subgroup analyses by age indicated that the value of improved prevention may take time to manifest. Approximately one-quarter of additional annual costs for individuals with type 1 diabetes age ≥48 years (∼25% of the cohort) could be prevented with insulin pump therapy.
Whether insulin pump therapy is cost efficient ultimately depends on therapeutic effects beyond resource use and costs as well as on how much the payer is prepared to invest in additional quality-adjusted life-years (QALYs). If the payer’s cost-effectiveness threshold is $50,000 per QALY gained, treatment needs to provide an average annual additional 0.1 QALY or, on the basis of the subgroup analyses, gains in the range of 0.06–0.12 QALY. Similarly, with a threshold of $100,000, the required gain in annual QALYs would have to be between 0.03 and 0.06. The average cost difference between insulin therapies in this study and a 20-year time horizon roughly correspond to a discounted (3%) lifetime cost difference of $62,000. The corresponding cost for a 40-year time horizon is $95,000. Previous model-based cost-effectiveness analyses have reported expected discounted QALY gains for a lifetime in the range of 0.46–1.06 QALYs, whereas the estimates of the increase in discounted lifetime costs varied (2).”
…
“One of the most devastating complications of diabetes is chronic kidney disease. Relative to the general population, persons with diabetes have a 5- to 13-fold risk of end-stage renal disease (ESRD) (4–6). ESRD extensively increases risk of death among patients with diabetes (7–9), and diabetes is the most common cause of ESRD in most industrialized countries (10); a study of 18 European countries showed that type 2 diabetes was the most frequent renal disease leading to initiation of renal replacement therapy (11).
Most earlier studies of the incidence of ESRD in diabetes have used prevalence cohorts, which means that patients have not been followed since their diabetes diagnosis. Patients with all types of diabetes typically have been included, and the incidence rate of ESRD has been 1–9 per 1,000 patient-years (4,12–14), with larger estimates among African Americans and those with a longer duration of diabetes. Notably, a prevalence cohort study from Italy including only patients with type 2 diabetes showed that only 10 of 1,408 patients developed ESRD over a 10-year follow-up (15). To our knowledge, only two inception cohort studies have addressed the incidence of ESRD. The UK Prospective Diabetes Study followed 5,097 patients with newly diagnosed type 2 diabetes, only 14 of whom required renal replacement therapy during the median follow-up of 10.4 years (16). However, the cumulative risk was not computed, and any subgroup analyses would not have been possible because of the small number of patients who developed ESRD. A population-based study from Saskatchewan, Canada, included 90,429 incident cases of diabetes among the adult study population, and the results showed an almost threefold risk of ESRD among indigenous patients (17). Among nonindigenous patients, the cumulative incidence of ESRD was ∼1–2% at 20 years since the diabetes diagnosis.
We and others have estimated the cumulative risk of ESRD in inception cohorts of patients with type 1 diabetes (18–21). Although type 2 diabetes is a major cause of ESRD, cumulative risk of ESRD after type 2 diabetes has been diagnosed is not well known. Here, we present the cumulative risk of ESRD during a 24-year follow-up of a nationwide population-based cohort of 421,429 patients newly diagnosed with type 2 diabetes in 1990–2011.”
“Of 421,429 patients diagnosed with type 2 diabetes in 1990–2011, 1,516 developed ESRD and 150,524 died before the end of 2013. The total number of patient-years of type 2 diabetes was 3,458,797 […]. The median follow-up was 6.82 years. A sex difference was found for age distribution: 70% of women and 55% of men were 60 years or older when type 2 diabetes was diagnosed. […] The cumulative risk of ESRD was 0.29% at 10 years and 0.74% at 20 years since the diagnosis of type 2 diabetes. […] Men had a 93% higher risk of ESRD than women. […] this male predominance is a common finding for all causes of ESRD (10). […] As an alternative analysis, the incidence rate of ESRD was calculated among all prevalent cases of type 2 diabetes in the time periods 1990–1999 and 2000–2011, thus including patients who were diagnosed with type 2 diabetes before 1990 but who contributed patient-years in 1990–2013 […]. During a total of 4,345,251 patient-years, 2,127 patients developed ESRD, resulting in an incidence rate of 0.49 per 1,000 patient-years (95% CI 0.47–0.51). The incidence rate was higher among men (0.66 [95% CI 0.63–0.70]) than among women (0.33 [95% CI 0.31–0.35]) and in 2000–2013 (0.53 [95% CI 0.51–0.56]) than in 1990–1999 (0.37 [95% CI 0.34–0.41]). The incidence rate of ESRD had increased most among men older than 70 years. For both men and women, the incidence rate of ESRD peaked among those aged 60–79 years.”
“Among patients diagnosed with type 2 diabetes between 1990 and 2011, the cumulative risk of death was 34% at 10 years and 64% at 20 years since the diagnosis of diabetes. […] Patients aged 70–79 years when diabetes was diagnosed had an eightfold risk of death during the follow-up compared with those aged 40–49 years. When calculating HR for death, occurrence of ESRD was included in the multivariable model as a time-dependent variable […], and ESRD increased the risk of death 4.2-fold during follow-up. […] In the interaction analysis, sex modified the effects of age and ESRD on HR for death. Among men, ESRD increased risk of death 3.8-fold and among women, 5.6-fold. Age (70–79 vs. 40–49 years) showed an HR for death of 7.4 among men and 9.8 among women. Also, a statistically significant interaction occurred between age and ESRD during follow-up, showing a weaker association between ESRD and risk of death among those aged 70 years or older (HR 3) than among those younger than 60 years (HR 5).”
“Our study shows that risk of ESRD is small among people with type 2 diabetes. This may seem unexpected, because a substantial proportion of patients are entering early stages of chronic kidney disease, with 25% of patients having microalbuminuria and 5% having macroalbuminuria 10 years after their diabetes diagnosis (16). These early stages of kidney disease are associated with increased premature mortality; this contributes to the fact that relatively few patients develop ESRD, as death is a common competing risk event. However, diabetes is the most common cause of ESRD in most industrialized countries, and because of a high and increasing prevalence of diabetes among the general population, a considerable absolute number of patients with type 2 diabetes need dialysis therapy (10,11). Our findings are important for clinicians who inform patients with type 2 diabetes about the associated risks and complications. […] Notably, people diagnosed with type 2 diabetes at an older age have a lower risk of ESRD and a higher risk of death than those diagnosed at a younger age. The cumulative risk of ESRD and death has decreased since the early 1990s among people with type 2 diabetes.”
…
“In a population-based observational study, HbA1c for 451 patients diagnosed with diabetes before 35 years of age during 1983–1987 in southeast Sweden was followed for up to 18–24 years from diagnosis. Long-term mean weighted HbA1c (wHbA1c) was calculated. Retinopathy was evaluated by fundus photography and analyzed in relation to wHbA1c levels.”
“RESULTS Lower wHbA1c, diabetes onset ≤5 years of age, and diabetes onset before puberty, but not sex, were associated with longer time to appearance of simplex retinopathy. Proliferative retinopathy was associated only with wHbA1c. The time to first appearance of any retinopathy decreased with increasing wHbA1c. Lower wHbA1c after ≤5 years’ diabetes duration was associated with later onset of simplex retinopathy but not proliferative retinopathy. With time, most patients developed simplex retinopathy, except for those of the category wHbA1c ≤50 mmol/mol (6.7%), for which 20 of 36 patients were without any retinopathy at the end of the follow-up in contrast to none of 49 with wHbA1c >80 mmol/mol (9.5%). […] At the end of the follow-up only 54 patients (12.5%) had no signs of retinopathy and 145 (33.6%) had slight simplex, 175 (40.5%) moderate simplex, and 57 (13.2%) proliferative retinopathy.”
“CONCLUSIONS Onset at ≤5 years of age and lower wHbA1c the first 5 years after diagnosis are associated with longer duration before development of simplex retinopathy. There is a strong positive association between long-term mean HbA1c measured from diagnosis and up to 20 years and appearance of both simplex and proliferative retinopathy.”
“Complete avoidance of retinopathy in patients with type 1 diabetes evidently requires a very tight glycemic control, which is very difficult to achieve with the treatment tools available today and is also dangerous because of the risk of severe hypoglycemia (27). […] In clinical practice, it is of great importance to find the balance between the risk of potentially dangerous hypoglycemic events and quality of life and the risk of severe microvascular complications to be able to recommend an evidence-based optimal level of HbA1c both in the short-term and in the long-term. The observation that wHbA1c before and during puberty did not influence the prevalence of proliferative retinopathy at 20 years’ diabetes duration is of clinical importance in the setting of targets for glycemic control in young children for whom severe hypoglycemia might be especially dangerous.
Simplex retinopathy is not sight threatening, even if advanced simplex retinopathy is a risk factor for proliferative retinopathy (13). However, simplex retinopathy may regress, and in our study simplex retinopathy regressed in a group of patients with mean wHbA1c 7.0% (SD 0.7%) (53 [8] mmol/mol). Proliferative retinopathy is clinically more relevant and should be avoided. We previously showed that the threshold for proliferative retinopathy is higher than for simplex retinopathy (28). Proliferative retinopathy did not occur in this material in patients with wHbA1c <7.6% (60 mmol/mol), which indicates what should be an important goal for glycemic control. This is in close agreement with the position statement for type 1 diabetes in children and adolescents recently issued by the American Diabetes Association recommending an HbA1c target of <7.5% (58 mmol/mol) (31).
In summary, after 20 years of diabetes duration, there is a strong positive association between long-term mean wHbA1c followed from diagnosis and appearance of both simplex and proliferative retinopathy. Diabetes onset at <5 years of age and lower wHbA1c the first 5 years after diagnosis are associated with longer duration before development of simplex retinopathy but not proliferative retinopathy. Proliferative retinopathy does not appear in patients with wHbA1c <7.6% (60 mmol/mol).”
…
“Spontaneous intracerebral hemorrhage (ICH) is a devastating condition accounting for 10–15% of all stroke cases. It is associated with a dismal prognosis, as only 38% of affected patients survive the first year (1).
Type 2 diabetes affects more than 415 million adults worldwide and is a well-known contributor to cardiovascular morbidity, cognitive decline, and all-cause mortality (2). Although diabetes is an independent risk factor for ischemic stroke (3), as yet there is no conclusive evidence for the association between diabetes and ICH, as previous studies showed conflicting results (4–8). […] We sought to determine 1) the association of diabetes and ICH and 2) the relationship between HbA1c levels and ICH in a large nationwide population-based cohort. […] We sought to determine 1) the association of diabetes and ICH and 2) the relationship between HbA1c levels and ICH in a large nationwide population-based cohort.”
…
Do keep in mind in the following that although the link between hemorrhagic stroke and diabetes is somewhat unclear (…for example: “in the Copenhagen Stroke Registry, hemorrhagic stroke was even six times less frequent in diabetic patients than in non-diabetic subjects (102). […] However, in another prospective population-based study DM was associated with an increased risk of primary intracerebral hemorrhage (103).”), the link between ischemic stroke and diabetes is strong and well-established – see the link for more details.
…
“This study is based on data from the computerized database of Clalit Health Services (CHS), which provides inclusive health care for more than half of the Israeli population. […] 313,130 patients had a preexisting diagnosis of diabetes and 1,167,585 individuals were without diabetes. Patients with diabetes had to have at least one test result for HbA1c in the 2 years before cohort entry (n = 297,486). Cohort participants (n = 1,465,071) were followed-up until reaching the study outcome (ICH), death, loss to follow-up, or end of follow-up at 31 December 2017 — whichever came first. […] The outcome of interest was ICH, defined as primary discharge diagnosis with ICH (ICD-9 code 431). […] Overall 4,170 patients had incident ICH during a mean (SD) follow-up of 7.3 (1.8) years and 10,730,915 person-years, reflecting an ICH crude incidence rate of 38.8 per 100,000 person-years. […] The strongest risk factors for ICH were prior ICH, prior stroke/transient ischemic attack (TIA), use of anticoagulation, hypertension, alcohol abuse, male sex, Arab ethnicity, chronic liver disease, and older age.”
“Because of the large number of potential confounders, we performed adjustment for a disease risk score (DRS), a summary measure of disease probability. The DRS was estimated using a Cox proportional hazards regression model for ICH outcome that included most clinically relevant ICH risk factors and other clinical covariates likely to be correlated with ICH […]. In comparison with conventional multivariate analyses, adjustment for the single variable DRS increases the efficiency of the analyses (16,17). It has been shown than the DRS and propensity score methods had comparable performance and that DRS has an advantage when multiple comparison groups are studied (16,17). […] The crude incidence rate of ICH was 78.9 per 100,000 person-years among patients with diabetes and 29.4 per 100,000 person-years among patients without diabetes (crude HR 2.69 [95% CI 2.53–2.87]) (Table 2). Diabetes remained significantly associated with ICH after adjustment for DRS (1.36 [1.27–1.45]). […] The results were unchanged after exclusion of new cases of diabetes and after censoring at the time of new diabetes diagnosis occurring during follow-up: DRS-adjusted HR 1.37 (95% CI 1.28–1.46) and 1.38 (1.29–1.47), respectively. […] The risk of ICH was directly associated with diabetes duration. Compared with the group without diabetes, the DRS-adjusted HR was 1.23 (95% CI 1.12–1.35) and 1.44 (1.34–1.56) for diabetes duration ≤5 years and >5 years, respectively. The corresponding HRs with adjustment for propensity score were 1.27 (1.15–1.41) and 1.65 (1.50–1.80), respectively […] HbA1c was significantly associated with ICH among patients with diabetes: adjusted HR 1.14 (95% CI 1.10–1.17) for each 1% increase in HbA1c […] HbA1c appears to have a nonlinear J-shaped relationship with ICH (Pnonlinearity = 0.0186), with the lowest risk observed at HbA1c of 6.5% (48 mmol/mol). […] The risk of ICH among patients with HbA1c of 6.5–6.7% (48–50 mmol/mol) was comparable with the risk in patients without diabetes, suggesting that albeit having diabetes, patients with good, but not extreme, diabetes control do not appear to have excess risk of ICH compared with patients without diabetes.”
“To date, the exact mechanisms underlying the association between diabetes, HbA1c, and ICH remain unknown. […] In summary, our study suggests that diabetes is associated with increased risk of ICH that is directly associated with diabetes duration. ICH and HbA1c appear to have a J-shaped relationship, suggesting that both poor control as well as extreme intensive diabetes control might be associated with increased risk.”
…
“Mainly based on the analysis of the data from patients with type 1 diabetes, in the clinical course of diabetic kidney disease it has long been considered that an increase of albuminuria, from normoalbuminuria (urine albumin-to-creatinine ratio ratio [UACR] <30 mg/g) to microalbuminuria (UACR 30–299 mg/g) to macroalbuminuria (UACR ≥300 mg/g), precedes the progression of renal decline (defined as estimated glomerular filtration rate [eGFR] <60 mL/min/1.73 m2) (1–3). Morphological changes known as nodular glomerular sclerosis (Kimmelstiel-Wilson nodule) have also been observed in patients with diabetes and loss of renal function (4,5). Therefore, patients with diabetes and reduced renal function are deemed to have overt proteinuria with nodular glomerular sclerosis. Recently, however, cumulative evidence from several cross-sectional studies revealed that a proportion of patients with type 2 diabetes develop progression of renal decline without proteinuria (macroalbuminuria) or even without microalbuminuria, suggesting the existence of a nonproteinuric phenotype of diabetic kidney disease defined as eGFR <60 mL/min/1.73 m2 and UACR <300 mg/g (6–11). Despite increasing attention, few clinical trials and longitudinal studies in type 2 diabetes include individuals without proteinuria or individuals with biopsy-proven diabetic kidney disease, and therefore their clinicopathological characteristics, renal prognosis, and all-cause mortality are very limited.
Similar to the U.S. and most countries in Europe, Japan has been suffering from the expanding trend in the continued increase of the prevalence of diabetic kidney disease that leads to end-stage renal disease (ESRD) and high mortality (12–15). Commissioned by the Ministry of Health, Labour and Welfare and the Japan Agency for Medical Research and Development with a goal of better understanding and halting the pandemic of diabetic kidney disease, we established a nationwide biopsy-based cohort of diabetic kidney disease with followed-up data, including ESRD and death ascertainment. Using this nationwide cohort and propensity score–matching methods, we aimed to investigate clinicopathological characteristics, renal prognosis, and mortality in patients with the nonproteinuric phenotype of diabetic kidney disease compared with patients with the classical proteinuric phenotype of diabetic kidney disease.”
“This is a retrospective study of patients who underwent clinical renal biopsy performed from 1 January 1985 to 31 December 2016 and had a pathological diagnosis of diabetic kidney disease at [one of] 18 hospitals in Japan […] 895 patients underwent clinical renal biopsy and had a pathological diagnosis of diabetic kidney disease in our cohort […]. We identified 526 who had an eGFR <60 mL/min/1.73 m2 at the time of biopsy. Among them, 88 had nonproteinuric diabetic kidney disease (UACR <300 mg/g), and 438 had proteinuric diabetic kidney disease (UACR ≥300 mg/g) at baseline. After propensity score matching, the nonproteinuric diabetic kidney disease group comprised 82 patients and the proteinuric diabetic kidney disease group comprised 164 patients […] In propensity score–matched cohorts, the blood pressure in patients with nonproteinuric diabetic kidney disease was better controlled compared with patients with proteinuric diabetic kidney disease, although patients with nonproteinuric diabetic kidney disease were less prescribed RAAS blockade. Patients with nonproteinuric diabetic kidney disease had lower total cholesterol levels and higher hemoglobin levels. For pathological characteristics, there was a difference in classification assignment for diabetic kidney disease between the nonproteinuric diabetic kidney disease group and proteinuric diabetic kidney disease group. […] Compared with the proteinuric diabetic kidney disease group, the nonproteinuric diabetic kidney disease group had less severe interstitial and vascular lesions. […] In a multivariable logistic regression model, older age, lower systolic blood pressure, higher hemoglobin level, and higher HbA1c were significantly associated with a higher odds of nonproteinuric diabetic kidney disease.”
“After a median follow-up of 1.8 years (IQR 0.9–3.7) from the date of renal biopsy, 297 (56%) of the 526 patients had renal events. The 5-year CKD progression-free survival was 33.2% (95% CI 28.4–38.2%) for all patients, 86.9% (95% CI 73.1–93.9%) for the nonproteinuric diabetic kidney disease group, and 24.5% (95% CI 19.8–29.5%) for the proteinuric diabetic kidney disease group (log-rank test P < 0.001) […]. The same trend was seen in the propensity score–matched cohort: After a median follow-up of 1.9 years (IQR 0.9–5.0) from the date of renal biopsy, 124 (50%) of the 246 matched patients had renal events. The 5-year CKD progression-free survival was 46.4% (95% CI 38.7–53.6%) for all patients, 86.6% (95% CI 72.5–93.8%) for the nonproteinuric diabetic kidney disease group, and 30.3% (95% CI 22.4–38.6%) for the proteinuric diabetic kidney disease group (log-rank test P < 0.001) […]. Similarly, for the secondary outcome (all-cause mortality), after a median follow-up of 2.7 years (IQR 1.1–5.7) from the date of renal biopsy, 55 (10%) of the 526 patients had death events. The 5-year death-free survival was 89.7% (95% CI 85.6–92.7%) for all patients, 98.4% (95% CI 89.1–99.8%) for the nonproteinuric diabetic kidney disease group, and 87.5% (95% CI 82.5–91.2%) for the proteinuric diabetic kidney disease group (log-rank test P < 0.001) […]. The same trend was seen in the propensity matched cohort: After a median follow-up of 3.1 years (IQR 1.3–7.0) from the date of renal biopsy, 35 (14%) of the 246 matched patients had death events. The 5-year death-free survival was 88.2% (95% CI 82.0–92.3%) for all patients, 98.3% (95% CI 88.7–99.8%) for the nonproteinuric diabetic kidney disease group, and 82.6% (95% CI 73.6–88.8%) for the proteinuric diabetic kidney disease group (log-rank test P = 0.005) […] The overall CKD progression incidence was significantly lower in the nonproteinuric diabetic kidney disease group (30 [95% CI 18–50] per 1,000 person-years) than in the proteinuric diabetic kidney disease group (231 [95% CI 191–278] per 1,000 person-years; crude HR 0.15 [95% CI 0.08–0.26]). After adjustment for age, sex, known duration of diabetes, and baseline eGFR, the risk of CKD progression remained lower in the nonproteinuric diabetic kidney disease cohort than in the proteinuric diabetic kidney disease cohort (adjusted HR 0.13 [95% CI 0.08–0.24]). The risk of CKD progression was consistently lower in the nonproteinuric diabetic kidney disease group than in the proteinuric diabetic kidney disease group when stratified by potential confounders such as age, sex, obesity, retinopathy, smoking status, use of RAAS blockade, hypertension, dyslipidemia, poor glycemic control, lower eGFR, and pathological findings.”
“In conclusion, in propensity score–matched cohorts of biopsy-proven nonproteinuric diabetic kidney disease and proteinuric diabetic kidney disease, patients with nonproteinuric diabetic kidney disease had lower blood pressure with less frequent typical pathological lesions and were at lower risk of CKD progression and all-cause mortality. Further studies are warranted to confirm these findings in other cohorts.”
…
vi. Single herbal medicine for diabetic retinopathy (Cochrane).
“Diabetic retinopathy is one of the major causes of blindness and the number of cases has risen in recent years. Herbal medicine has been used to treat diabetes and its complications including diabetic retinopathy for thousands of years around the world. However, common practice is not always evidence‐based. Evidence is needed to help people with diabetic retinopathy or doctors to make judicious judgements about using herbal medicine as treatment.”
“We included 10 studies involving 754 participants, of which nine were conducted in China and one in Poland. In all studies, participants in both groups received conventional treatment for diabetic retinopathy which included maintaining blood glucose and lipids using medicines and keeping a stable diabetic diet. In three studies, the comparator group also received an additional potentially active comparator in the form of a vasoprotective drug. The single herbs or extracts included Ruscus extract tablet, Sanqi Tongshu capsule, tetramethylpyrazine injection, Xueshuantong injection, Puerarin injection and Xuesaitong injection. The Sanqi Tongshu capsule, Xueshuantong injection and Xuesaitong injection were all made from the extract of Radix Notoginseng (San qi) and the main ingredient was sanchinoside. The risk of bias was high in all included studies mainly due to lack of masking (blinding). None of the studies reported the primary outcome of this review, progression of retinopathy.
Combined analysis of herbal interventions suggested that people who took these herbs in combination with conventional treatment may have been more likely to gain 2 or more lines of visual acuity compared to people who did not take these herbs when compared to conventional intervention alone at the end of treatment (RR 1.26, 95% CI 1.08 to 1.48; 5 trials, 541 participants; low‐certainty evidence). Subgroup analyses based on the different single herbs found no evidence for different effects of different herbs, but the power of this analysis was low. […]
Authors’ conclusions
No conclusions could be drawn about the effect of any single herb or herbal extract on diabetic retinopathy from the current available evidence. It was difficult to exclude the placebo effect as a possible explanation for observed differences due to the lack of placebo control in the included studies. Further adequately designed trials are needed to establish the evidence.”
Links and random stuff
i. Pulmonary Aspects of Exercise and Sports.
“Although the lungs are a critical component of exercise performance, their response to exercise and other environmental stresses is often overlooked when evaluating pulmonary performance during high workloads. Exercise can produce capillary leakage, particularly when left atrial pressure increases related to left ventricular (LV) systolic or diastolic failure. Diastolic LV dysfunction that results in elevated left atrial pressure during exercise is particularly likely to result in pulmonary edema and capillary hemorrhage. Data from race horses, endurance athletes, and triathletes support the concept that the lungs can react to exercise and immersion stress with pulmonary edema and pulmonary hemorrhage. Immersion in water by swimmers and divers can also increase stress on pulmonary capillaries and result in pulmonary edema.”
“Zavorsksy et al.11 studied individuals under several different workloads and performed lung imaging to document the presence or absence of lung edema. Radiographic image readers were blinded to the exposures and reported visual evidence of lung fluid. In individuals undergoing a diagnostic graded exercise test, no evidence of lung edema was noted. However, 15% of individuals who ran on a treadmill at 70% of maximum capacity for 2 hours demonstrated evidence of pulmonary edema, as did 65% of those who ran at maximum capacity for 7 minutes. Similar findings were noted in female athletes.12 Pingitore et al. examined 48 athletes before and after completing an iron man triathlon. They used ultrasound to detect lung edema and reported the incidence of ultrasound lung comets.13 None of the athletes had evidence of lung edema before the event, while 75% showed evidence of pulmonary edema immediately post-race, and 42% had persistent findings of pulmonary edema 12 hours post-race. Their data and several case reports14–16 have demonstrated that extreme exercise can result in pulmonary edema”
“Conclusions
Sports and recreational participation can result in lung injury caused by high pulmonary pressures and increased blood volume that raises intracapillary pressure and results in capillary rupture with subsequent pulmonary edema and hemorrhage. High-intensity exercise can result in accumulation of pulmonary fluid and evidence of pulmonary edema. Competitive swimming can result in both pulmonary edema related to fluid shifts into the thorax from immersion and elevated LV end diastolic pressure related to diastolic dysfunction, particularly in the presence of high-intensity exercise. […] The most important approach to many of these disorders is prevention. […] Prevention strategies include avoiding extreme exercise, avoiding over hydration, and assuring that inspiratory resistance is minimized.”
…
ii. Some interesting thoughts on journalism and journalists from a recent SSC Open Thread by user ‘Well’ (quotes from multiple comments). His/her thoughts seem to line up well with my own views on these topics, and one of the reasons why I don’t follow the news is that my own answer to the first question posed below is quite briefly that, ‘…well, I don’t’:
“I think a more fundamental problem is the irrational expectation that newsmedia are supposed to be a reliable source of information in the first place. Why do we grant them this make-believe power?
The English and Acting majors who got together to put on the shows in which they pose as disinterested arbiters of truth use lots of smoke and mirror techniques to appear authoritative: they open their programs with regal fanfare, they wear fancy suits, they make sure to talk or write in a way that mimics the disinterestedness of scholarly expertise, they appear with spinning globes or dozens of screens behind them as if they’re omniscient, they adorn their publications in fancy black-letter typefaces and give them names like “Sentinel” and “Observer” and “Inquirer” and “Plain Dealer”, they invented for themselves the title of “journalists” as if they take part in some kind of peer review process… But why do these silly tricks work? […] what makes the press “the press” is the little game of make-believe we play where an English or Acting major puts on a suit, talks with a funny cadence in his voice, sits in a movie set that looks like God’s Control Room, or writes in a certain format, using pseudo-academic language and symbols, and calls himself a “journalist” and we all pretend this person is somehow qualified to tell us what is going on in the world.
Even when the “journalist” is saying things we agree with, why do we participate in this ridiculous charade? […] I’m not against punditry or people putting together a platform to talk about things that happen. I’m against people with few skills other than “good storyteller” or “good writer” doing this while painting themselves as “can be trusted to tell you everything you need to know about anything”. […] Inasumuch as what I’m doing can be called “defending” them, I’d “defend” them not because they are providing us with valuable facts (ha!) but because they don’t owe us facts, or anything coherent, in the first place. It’s not like they’re some kind of official facts-providing service. They just put on clothes to look like one.”
…
iii. Chatham house rule.
…
iv. Sex Determination: Why So Many Ways of Doing It?
“Sexual reproduction is an ancient feature of life on earth, and the familiar X and Y chromosomes in humans and other model species have led to the impression that sex determination mechanisms are old and conserved. In fact, males and females are determined by diverse mechanisms that evolve rapidly in many taxa. Yet this diversity in primary sex-determining signals is coupled with conserved molecular pathways that trigger male or female development. Conflicting selection on different parts of the genome and on the two sexes may drive many of these transitions, but few systems with rapid turnover of sex determination mechanisms have been rigorously studied. Here we survey our current understanding of how and why sex determination evolves in animals and plants and identify important gaps in our knowledge that present exciting research opportunities to characterize the evolutionary forces and molecular pathways underlying the evolution of sex determination.”
…
v. So Good They Can’t Ignore You.
“Cal Newport’s 2012 book So Good They Can’t Ignore You is a career strategy book designed around four ideas.
The first idea is that ‘follow your passion’ is terrible career advice, and people who say this should be shot don’t know what they’re talking about. […] The second idea is that instead of believing in the passion hypothesis, you should adopt what Newport calls the ‘craftsman mindset’. The craftsman mindset is that you should focus on gaining rare and valuable skills, since this is what leads to good career outcomes.
The third idea is that autonomy is the most important component of a ‘dream’ job. Newport argues that when choosing between two jobs, there are compelling reasons to ‘always’ pick the one with higher autonomy over the one with lower autonomy.
The fourth idea is that having a ‘mission’ or a ‘higher purpose’ in your job is probably a good idea, and is really nice if you can find it. […] the book structure is basically: ‘following your passion is bad, instead go for Mastery[,] Autonomy and Purpose — the trio of things that have been proven to motivate knowledge workers’.” […]
“Newport argues that applying deliberate practice to your chosen skill market is your best shot at becoming ‘so good they can’t ignore you’. The key is to stretch — you want to practice skills that are just above your current skill level, so that you experience discomfort — but not too much discomfort that you’ll give up.” […]
“Newport thinks that if your job has one or more of the following qualities, you should leave your job in favour of another where you can build career capital:
- Your job presents few opportunities to distinguish yourself by developing relevant skills that are rare and valuable.
- Your job focuses on something you think is useless or perhaps even actively bad for the world.
- Your job forces you to work with people you really dislike.
If you’re in a job with any of these traits, your ability to gain rare and valuable skills would be hampered. So it’s best to get out.”
…
vi. Structural brain imaging correlates of general intelligence in UK Biobank.
“The association between brain volume and intelligence has been one of the most regularly-studied—though still controversial—questions in cognitive neuroscience research. The conclusion of multiple previous meta-analyses is that the relation between these two quantities is positive and highly replicable, though modest (Gignac & Bates, 2017; McDaniel, 2005; Pietschnig, Penke, Wicherts, Zeiler, & Voracek, 2015), yet its magnitude remains the subject of debate. The most recent meta-analysis, which included a total sample size of 8036 participants with measures of both brain volume and intelligence, estimated the correlation at r = 0.24 (Pietschnig et al., 2015). A more recent re-analysis of the meta-analytic data, only including healthy adult samples (N = 1758), found a correlation of r = 0.31 (Gignac & Bates, 2017). Furthermore, the correlation increased as a function of intelligence measurement quality: studies with better-quality intelligence tests—for instance, those including multiple measures and a longer testing time—tended to produce even higher correlations with brain volume (up to 0.39). […] Here, we report an analysis of data from a large, single sample with high-quality MRI measurements and four diverse cognitive tests. […] We judge that the large N, study homogeneity, and diversity of cognitive tests relative to previous large scale analyses provides important new evidence on the size of the brain structure-intelligence correlation. By investigating the relations between general intelligence and characteristics of many specific regions and subregions of the brain in this large single sample, we substantially exceed the scope of previous meta-analytic work in this area. […]
“We used a large sample from UK Biobank (N = 29,004, age range = 44–81 years). […] This preregistered study provides a large single sample analysis of the global and regional brain correlates of a latent factor of general intelligence. Our study design avoids issues of publication bias and inconsistent cognitive measurement to which meta-analyses are susceptible, and also provides a latent measure of intelligence which compares favourably with previous single-indicator studies of this type. We estimate the correlation between total brain volume and intelligence to be r = 0.276, which applies to both males and females. Multiple global tissue measures account for around double the variance in g in older participants, relative to those in middle age. Finally, we find that associations with intelligence were strongest in frontal, insula, anterior and medial temporal, lateral occipital and paracingulate cortices, alongside subcortical volumes (especially the thalamus) and the microstructure of the thalamic radiations, association pathways and forceps minor.”
…
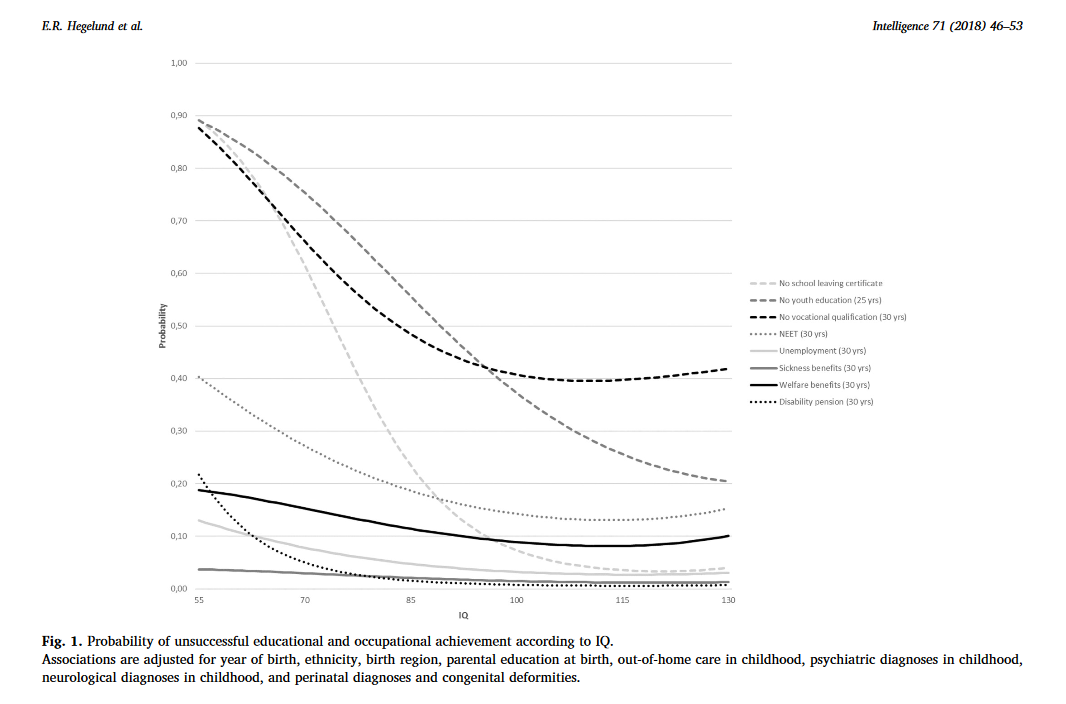
vii. Another IQ study: Low IQ as a predictor of unsuccessful educational and occupational achievement: A register-based study of 1,098,742 men in Denmark 1968–2016.
“Intelligence test score is a well-established predictor of educational and occupational achievement worldwide […]. Longitudinal studies typically report cor-relation coefficients of 0.5–0.6 between intelligence and educational achievement as assessed by educational level or school grades […], correlation coefficients of 0.4–0.5 between intelligence and occupational level […] and cor-relation coefficients of 0.2–0.4 between intelligence and income […]. Although the above-mentioned associations are well-established, low intelligence still seems to be an overlooked problem among young people struggling to complete an education or gain a foothold in the labour market […] Due to contextual differences with regard to educational system and flexibility and security on the labour market as well as educational and labour market policies, the role of intelligence in predicting unsuccessful educational and occupational courses may vary among countries. As Denmark has free admittance to education at all levels, state financed student grants for all students, and a relatively high support of students with special educational needs, intelligence might be expected to play a larger role – as socioeconomic factors might be of less importance – with regard to educational and occupational achievement compared with countries outside Scandinavia. The aim of this study was therefore to investigate the role of IQ in predicting a wide range of indicators of unsuccessful educational and occupational achievement among young people born across five decades in Denmark.”
“Individuals who differed in IQ score were found to differ with regard to all indicators of unsuccessful educational and occupational achievement such that low IQ was associated with a higher proportion of unsuccessful educational and occupational achievement. For example, among the 12.1% of our study population who left lower secondary school without receiving a certificate, 39.7% had an IQ < 80 and 23.1% had an IQ of 80–89, although these individuals only accounted for 7.8% and 13.1% of the total study population. The main analyses showed that IQ was inversely associated with all indicators of unsuccessful educational and occupational achievement in young adulthood after adjustment for covariates […] With regard to unsuccessful educational achievement, […] the probabilities of no school leaving certificate, no youth education at age 25, and no vocational qualification at age 30 decreased with increasing IQ in a cubic relation, suggesting essentially no or only weak associations at superior IQ levels. IQ had the strongest influence on the probability of no school leaving certificate. Although the probabilities of the three outcome indicators were almost the same among individuals with extremely low IQ, the probability of no school leaving certificate approached zero among individuals with an IQ of 100 or above whereas the probabilities of no youth education at age 25 and no vocational qualification at age 30 remained notably higher. […] individuals with an IQ of 70 had a median gross income of 301,347 DKK, individuals with an IQ of 100 had a median gross income of 331,854, and individuals with an IQ of 130 had a median gross income of 363,089 DKK – in the beginning of June 2018 corresponding to about 47,856 USD, 52,701 USD, and 57,662 USD, respectively. […] The results showed that among individuals undergoing education, low IQ was associated with a higher hazard rate of passing to employment, unemployment, sickness benefits receipt and welfare benefits receipt […]. This indicates that individuals with low IQ tend to leave the educational system to find employment at a younger age than individuals with high IQ, but that this early leave from the educational system often is associated with a transition into unemployment, sickness benefits receipt and welfare benefits receipt.”
“Conclusions
This study of 1,098,742 Danish men followed in national registers from 1968 to 2016 found that low IQ was a strong and consistent predictor of 10 indicators of unsuccessful educational and occupational achievement in young adulthood. Overall, it seemed that IQ had the strongest influence on the risk of unsuccessful educational achievement and on the risk of disability pension, and that the influence of IQ on educational achievement was strongest in the early educational career and decreased over time. At the community level our findings suggest that intelligence should be considered when planning interventions to reduce the rates of early school leaving and the unemployment rates and at the individual level our findings suggest that assessment of intelligence may provide crucial information for the counselling of poor-functioning schoolchildren and adolescents with regard to both the immediate educational goals and the more distant work-related future.”
A few diabetes papers of interest
Some observations from the paper:
“Type 1 diabetes is preceded by the presence of preclinical, persistent islet autoantibodies (1). Autoantibodies against insulin (IAA) (2), GAD (GADA), insulinoma-associated antigen 2 (IA-2A) (3), and/or zinc transporter 8 (ZnT8A) (4) are typically present prior to development of symptomatic hyperglycemia and progression to clinical disease. These autoantibodies may develop many years before onset of type 1 diabetes, and increasing autoantibody number and titers have been associated with increased risk of progression to disease (5–7).
Identical twins have an increased risk of progression of islet autoimmunity and type 1 diabetes after one twin is diagnosed, although reported rates have been highly variable (30–70%) (8–11). This risk is increased if the proband twin develops diabetes at a young age (12). Concordance rates for type 1 diabetes in monozygotic twins with long-term follow-up is >50% (13). Risk for development of islet autoimmunity and type 1 diabetes for nonidentical twins is thought to be similar to non-twin siblings (risk of 6–10% for diabetes) (14). Full siblings who inherit both high-risk HLA (HLA DQA1*05:01 DR3/4*0302) haplotypes identical to their proband sibling with type 1 diabetes have a much higher risk for development of diabetes than those who share only one or zero haplotypes (55% vs. 5% by 12 years of age, respectively; P = 0.03) (15). Despite sharing both HLA haplotypes with their proband, siblings without the HLA DQA1*05:01 DR3/4*0302 genotype had only a 25% risk for type 1 diabetes by 12 years of age (15).”
“The TrialNet Pathway to Prevention Study (previously the TrialNet Natural History Study; 16) has been screening relatives of patients with type 1 diabetes since 2004 and follows these subjects with serial autoantibody testing for the development of islet autoantibodies and type 1 diabetes. The study offers longitudinal monitoring for autoantibody-positive subjects through HbA1c testing and oral glucose tolerance tests (OGTTs).”
“The purpose of this study was to evaluate the prevalence of islet autoantibodies and analyze a logistic regression model to test the effects of genetic factors and common twin environment on the presence or absence of islet autoantibodies in identical twins, nonidentical twins, and full siblings screened in the TrialNet Pathway to Prevention Study. In addition, this study analyzed the presence of islet autoantibodies (GADA, IA-2A, and IAA) and risk of type 1 diabetes over time in identical twins, nonidentical twins, and full siblings followed in the TrialNet Pathway to Prevention Study. […] A total of 48,051 sibling subjects were initially screened (288 identical twins, 630 nonidentical twins, and 47,133 full siblings). Of these, 48,026 had an initial screening visit with GADA, IA2A, and IAA results (287 identical twins, 630 nonidentical twins, and 47,109 full siblings). A total of 17,226 participants (157 identical twins, 283 nonidentical twins and 16,786 full siblings) were followed for a median of 2.1 years (25th percentile 1.1 year and 75th percentile 4.0 years), with follow-up defined as at least ≥12 months follow-up after initial screening visit.”
“At the initial screening visit, GADA was present in 20.2% of identical twins (58 out of 287), 5.6% of nonidentical twins (35 out of 630), and 4.7% of full siblings (2,205 out of 47,109) (P < 0.0001). Additionally, IA-2A was present primarily in identical twins (9.4%; 27 out of 287) and less so in nonidentical twins (3.3%; 21 out of 630) and full siblings (2.2%; 1,042 out of 47,109) (P = 0.0001). Nearly 12% of identical twins (34 out of 287) were positive for IAA at initial screen, whereas 4.6% of nonidentical twins (29 out of 630) and 2.5% of full siblings (1,152 out of 47,109) were initially IAA positive (P < 0.0001).”
“At 3 years of follow-up, the risk for development of GADA was 16% for identical twins, 5% for nonidentical twins, and 4% for full siblings (P < 0.0001) (Fig. 1A). The risk for development of IA-2A by 3 years of follow-up was 7% for identical twins, 4% for nonidentical twins, and 2% for full siblings (P = 0.0005) (Fig. 1B). At 3 years of follow-up, the risk of development of IAA was 10% for identical twins, 5% for nonidentical twins, and 4% for full siblings (P = 0.006) […] In initially autoantibody-negative subjects, 1.5% of identical twins, 0% of nonidentical twins, and 0.5% of full siblings progressed to diabetes at 3 years of follow-up (P = 0.18) […] For initially single autoantibody–positive subjects, at 3 years of follow-up, 69% of identical twins, 13% of nonidentical twins, and 12% of full siblings developed type 1 diabetes (P < 0.0001) […] Subjects who were positive for multiple autoantibodies at screening had a higher risk of developing type 1 diabetes at 3 years of follow-up with 69% of identical twins, 72% of nonidentical twins, and 47% of full siblings developing type 1 diabetes (P = 0.079)”
“Because TrialNet is not a birth cohort and the median age at screening visit was 11 years overall, this study would not capture subjects who had initial seroconversion at a young age and then progressed through the intermediate stage of multiple antibody positivity before developing diabetes.”
“This study of >48,000 siblings of patients with type 1 diabetes shows that at initial screening, identical twins were more likely to have at least one positive autoantibody and be positive for GADA, IA-2A, and IAA than either nonidentical twins or full siblings. […] risk for development of type 1 diabetes at 3 years of follow-up was high for both single and multiple autoantibody–positive identical twins (62–69%) and multiple autoantibody–positive nonidentical twins (72%) compared with 47% for initially multiple autoantibody–positive full siblings and 12–13% for initially single autoantibody–positive nonidentical twins and full siblings. To our knowledge, this is the largest prediagnosis study to evaluate the effects of genetic factors and common twin environment on the presence or absence of islet autoantibodies.
In this study, younger age, male sex, and genetic factors were significantly associated with expression of IA-2A, IAA, more than one autoantibody, and more than two autoantibodies, whereas only genetic factors were significant for GADA. An influence of common twin environment (E) was not seen. […] Previous studies have shown that identical twin siblings of patients with type 1 diabetes have a higher concordance rate for development of type 1 diabetes compared with nonidentical twins, although reported rates for identical twins have been highly variable (30–70%) […]. Studies from various countries (Australia, Denmark, Finland, Great Britain, and U.S.) have reported concordance rates for nonidentical twins ∼5–15% […]. Concordance rates have been higher when the proband was diagnosed at a younger age (8), which may explain the variability in these reported rates. In this study, autoantibody-negative nonidentical and identical twins had a low risk of type 1 diabetes by 3 years of follow-up. In contrast, once twins developed autoantibodies, risk for type 1 diabetes was high for multiple autoantibody nonidentical twins and both single and multiple autoantibody identical twins.”
…
This is another paper in the ‘‘ segment from the February edition of Diabetes Care – multiple other papers on related topics were also included in that edition, so if you’re interested in the genetics of diabetes it may be worth checking out.
Some observations from the paper:
“Type 2 diabetes is a progressive disease due to a gradual reduction in the capacity of the pancreatic islet cells (β-cells) to produce insulin (1). The clinical course of this progression is highly variable, with some patients progressing very rapidly to requiring insulin treatment, whereas others can be successfully treated with lifestyle changes or oral agents for many years (1,2). Being able to identify patients likely to rapidly progress may have clinical utility in prioritization monitoring and treatment escalation and in choice of therapy.
It has previously been shown that many patients with clinical features of type 2 diabetes have positive GAD65 autoantibodies (GADA) and that the presence of this autoantibody is associated with faster progression to insulin (3,4). This is often termed latent autoimmune diabetes in adults (LADA) (5,6). However, the predictive value of GADA testing is limited in a population with clinical type 2 diabetes, with many GADA-positive patients not requiring insulin treatment for many years (4,7). Previous research has suggested that genetic variants in the HLA region associated with type 1 diabetes are associated with more rapid progression to insulin in patients with clinically defined type 2 diabetes and positive GADA (8).
We have recently developed a type 1 diabetes genetic risk score (T1D GRS), which provides an inexpensive ($70 in our local clinical laboratory and <$20 where DNA has been previously extracted), integrated assessment of a person’s genetic susceptibility to type 1 diabetes (9). The score is composed of 30 type 1 diabetes risk variants weighted for effect size and aids discrimination of type 1 diabetes from type 2 diabetes. […] We aimed to determine if the T1D GRS could predict rapid progression to insulin (within 5 years of diagnosis) over and above GADA testing in patients with a clinical diagnosis of type 2 diabetes treated without insulin at diagnosis.”
“We examined the relationship between GADA, T1D GRS, and progression to insulin therapy using survival analysis in 8,608 participants with clinical type 2 diabetes initially treated without insulin therapy. […] In this large study of participants with a clinical diagnosis of type 2 diabetes, we have found that type 1 genetic susceptibility alters the clinical implications of a positive GADA when predicting rapid time to insulin. GADA-positive participants with high T1D GRS were more likely to require insulin within 5 years of diagnosis, with 48% progressing to insulin in this time in contrast to only 18% in participants with low T1D GRS. The T1D GRS was independent of and additive to participant’s age of diagnosis and BMI. However, T1D GRS was not associated with rapid insulin requirement in participants who were GADA negative.”
“Our findings have clear implications for clinical practice. The T1D GRS represents a novel clinical test that can be used to enhance the prognostic value of GADA testing. For predicting future insulin requirement in patients with apparent type 2 diabetes who are GADA positive, T1D GRS may be clinically useful and can be used as an additional test in the screening process. However, in patients with type 2 diabetes who are GADA negative, there is no benefit gained from genetic testing. This is unsurprising, as the prevalence of underlying autoimmunity in patients with a clinical phenotype of type 2 diabetes who are GADA negative is likely to be extremely low; therefore, most GADA-negative participants with high T1D GRS will have nonautoimmune diabetes. The use of this two-step testing approach may facilitate a precision medicine approach to patients with apparent type 2 diabetes; patients who are likely to progress rapidly are identified for targeted management, which may include increased monitoring, early therapy intensification, and/or interventions aimed at slowing progression (36,37).
The costs of analyzing the T1D GRS are relatively modest and may fall further, as genetic testing is rapidly becoming less expensive (38). […] In conclusion, a T1D GRS alters the clinical implications of a positive GADA test in patients with clinical type 2 diabetes and is independent of and additive to clinical features. This therefore represents a novel test for identifying patients with rapid progression in this population.”
…
iii. Retinopathy and RAAS Activation: Results From the Canadian Study of Longevity in Type 1 Diabetes.
“Diabetic retinopathy is the most common cause of preventable blindness in individuals ages 20–74 years and is the most common vascular complication in type 1 and type 2 diabetes (1–3). On the basis of increasing severity, diabetic retinopathy is classified into nonproliferative diabetic retinopathy (NPDR), defined in early stages by the presence of microaneurysms, retinal vascular closure, and alteration, or proliferative diabetic retinopathy (PDR), defined by the growth of new aberrant blood vessels (neovascularization) susceptible to hemorrhage, leakage, and fibrosis (4). Diabetic macular edema (DME) can be present at any stage of retinopathy and is characterized by increased vascular permeability leading to retinal thickening.
Important risk factors for the development of retinopathy continue to be chronic hyperglycemia, hyperlipidemia, hypertension, and diabetes duration (5,6). Given the systemic nature of these risk factors, cooccurrence of retinopathy with other vascular complications is common in patients with diabetes.”
“A key pathway implicated in diabetes-related small-vessel disease is overactivation of neurohormones. Activation of the neurohormonal renin-angiotensin-aldosterone system (RAAS) pathway predominates in diabetes in response to hyperglycemia and sodium retention. The RAAS plays a pivotal role in regulating systemic BP through vasoconstriction and fluid-electrolyte homeostasis. At the tissue level, angiotensin II (ANGII), the principal mediator of the RAAS, is implicated in fibrosis, oxidative stress, endothelial damage, thrombosis, inflammation, and vascular remodeling. Of note, systemic RAAS blockers reduce the risk of progression of eye disease but not DKD [Diabetic Kidney Disease, US] in adults with type 1 diabetes with normoalbuminuria (12).
Several longitudinal epidemiologic studies of diabetic retinopathy have been completed in type 1 diabetes; however, few have studied the relationships between eye, nerve, and renal complications and the influence of RAAS activation after prolonged duration (≥50 years) in adults with type 1 diabetes. As a result, less is known about mechanisms that persist in diabetes-related microvascular complications after long-standing diabetes. Accordingly, in this cross-sectional analysis from the Canadian Study of Longevity in Type 1 Diabetes involving adults with type 1 diabetes for ≥50 years, our aims were to phenotype retinopathy stage and determine associations between the presence of retinopathy and other vascular complications. In addition, we examined the relationship between retinopathy stage and renal and systemic hemodynamic function, including arterial stiffness, at baseline and dynamically after RAAS activation with an infusion of exogenous ANGII.”
“Of the 75 participants, 12 (16%) had NDR [no diabetic retinopathy], 24 (32%) had NPDR, and 39 (52%) had PDR […]. At baseline, those with NDR had lower mean HbA1c compared with those with NPDR and PDR (7.4 ± 0.7% and 7.5 ± 0.9%, respectively; P for trend = 0.019). Of note, those with more severe eye disease (PDR) had lower systolic and diastolic BP values but a significantly higher urine albumin-to-creatine ratio (UACR) […] compared with those with less severe eye disease (NPDR) or with NDR despite higher use of RAAS inhibitors among those with PDR compared with NPDR or NDR. History of cardiovascular and peripheral vascular disease history was significantly higher in participants with PDR (33.3%) than in those with NPDR (8.3%) or NDR (0%). Diabetic sensory polyneuropathy was prevalent across all groups irrespective of retinopathy status but was numerically higher in the PDR group (95%) than in the NPDR (86%) or NDR (75%) groups. No significant differences were observed in retinal thickness across the three groups.”
One quick note: This was mainly an eye study, but some of the other figures here are well worth taking note of. 3 out of 4 people in the supposedly low-risk group without eye complications had sensory polyneuropathy after 50 years of diabetes.
“Conclusions
Hyperglycemia contributes to the pathogenesis of diabetic retinopathy through multiple interactive pathways, including increased production of advanced glycation end products, IGF-I, vascular endothelial growth factor, endothelin, nitric oxide, oxidative damage, and proinflammatory cytokines (29–33). Overactivation of the RAAS in response to hyperglycemia also is implicated in the pathogenesis of diabetes-related complications in the retina, nerves, and kidney and is an important therapeutic target in type 1 diabetes. Despite what is known about these underlying pathogenic mechanisms in the early development of diabetes-related complications, whether the same mechanisms are active in the setting of long-standing type 1 diabetes is not known. […] In this study, we observed that participants with PDR were more likely to be taking RAAS inhibitors, to have a higher frequency of cardiovascular or peripheral vascular disease, and to have higher UACR levels, likely reflecting the higher overall risk profile of this group. Although it is not possible to determine why some patients in this cohort developed PDR while others did not after similar durations of type 1 diabetes, it seems unlikely that glycemic control alone is sufficient to fully explain the observed between-group differences and differing vascular risk profiles. Whereas the NDR group had significantly lower mean HbA1c levels than the NPDR and PDR groups, differences between participants with NPDR and those with PDR were modest. Accordingly, other factors, such as differences in vascular function, neurohormones, growth factors, genetics, and lifestyle, may play a role in determining retinopathy severity at the individual level.
The association between retinopathy and risk for DKD is well established in diabetes (34). In the setting of type 2 diabetes, patients with high levels of UACR have twice the risk of developing diabetic retinopathy than those with normal UACR levels. For example, Rodríguez-Poncelas et al. (35) demonstrated that impaired renal function is linked with increased diabetic retinopathy risk. Consistent with these studies and others, the PDR group in this Canadian Study of Longevity in Type 1 Diabetes demonstrated significantly higher UACR, which is associated with an increased risk of DKD progression, illustrating that the interaction between eye and kidney disease progression also may exist in patients with long-standing type 1 diabetes. […] In conclusion, retinopathy was prevalent after prolonged type 1 diabetes duration, and retinopathy severity associated with several measures of neuropathy and with higher UACR. Differential exaggerated responses to RAAS activation in the peripheral vasculature of the PDR group highlights that even in the absence of DKD, neurohormonal abnormalities are likely still operant, and perhaps accentuated, in patients with PDR even after long-standing type 1 diabetes duration.”
…
iv. Clinical and MRI Features of Cerebral Small-Vessel Disease in Type 1 Diabetes.
“Type 1 diabetes is associated with a fivefold increased risk of stroke (1), with cerebral small-vessel disease (SVD) as the most common etiology (2). Cerebral SVD in type 1 diabetes, however, remains scarcely investigated and is challenging to study in vivo per se owing to the size of affected vasculature (3); instead, MRI signs of SVD are studied. In this study, we aimed to assess the prevalence of cerebral SVD in subjects with type 1 diabetes compared with healthy control subjects and to characterize diabetes-related variables associated with SVD in stroke-free people with type 1 diabetes.”
“RESEARCH DESIGN AND METHODS This substudy was cross-sectional in design and included 191 participants with type 1 diabetes and median age 40.0 years (interquartile range 33.0–45.1) and 30 healthy age- and sex-matched control subjects. All participants underwent clinical investigation and brain MRIs, assessed for cerebral SVD.
RESULTS Cerebral SVD was more common in participants with type 1 diabetes than in healthy control subjects: any marker 35% vs. 10% (P = 0.005), cerebral microbleeds (CMBs) 24% vs. 3.3% (P = 0.008), white matter hyperintensities 17% vs. 6.7% (P = 0.182), and lacunes 2.1% vs. 0% (P = 1.000). Presence of CMBs was independently associated with systolic blood pressure (odds ratio 1.03 [95% CI 1.00–1.05], P = 0.035).”
“Conclusions
Cerebral SVD is more common in participants with type 1 diabetes than in healthy control subjects. CMBs especially are more prevalent and are independently associated with hypertension. Our results indicate that cerebral SVD starts early in type 1 diabetes but is not explained solely by diabetes-related vascular risk factors or the generalized microvascular disease that takes place in diabetes (7).
There are only small-scale studies on cerebral SVD, especially CMBs, in type 1 diabetes. Compared with the current study, one study with similar diabetes characteristics (i.e., diabetes duration, glycemic control, and blood pressure levels) as in the current study, but lacking a control population, showed a higher prevalence of WMHs, with more than half of the participants affected, but similar prevalence of lacunes and lower prevalence of CMBs (8). In another study, including 67 participants with type 1 diabetes and 33 control subjects, there was no difference in WMH prevalence but a higher prevalence of CMBs in participants with type 1 diabetes and retinopathy compared with control subjects (9). […] In type 1 diabetes, albuminuria and systolic blood pressure independently increase the risk for both ischemic and hemorrhagic stroke (12). […] We conclude that cerebral SVD is more common in subjects with type 1 diabetes than in healthy control subjects. Future studies will focus on longitudinal development of SVD in type 1 diabetes and the associations with brain health and cognition.”
…
“In the U.S., an estimated 1.4 million adults are newly diagnosed with diabetes every year and present an important intervention opportunity for health care systems. In patients newly diagnosed with type 2 diabetes, the benefits of maintaining an HbA1c <7.0% (<53 mmol/mol) are well established. The UK Prospective Diabetes Study (UKPDS) found that a mean HbA1c of 7.0% (53 mmol/mol) lowers the risk of diabetes-related end points by 12–32% compared with a mean HbA1c of 7.9% (63 mmol/mol) (1,2). Long-term observational follow-up of this trial revealed that this early glycemic control has durable effects: Reductions in microvascular events persisted, reductions in cardiovascular events and mortality were observed 10 years after the trial ended, and HbA1c values converged (1). Similar findings were observed in the Diabetes Control and Complications Trial (DCCT) in patients with type 1 diabetes (2–4). These posttrial observations have been called legacy effects (also metabolic memory) (5), and they suggest the importance of early glycemic control for the prevention of future complications of diabetes. Although these clinical trial long-term follow-up studies demonstrated legacy effects, whether legacy effects exist in real-world populations, how soon after diabetes diagnosis legacy effects may begin, or for what level of glycemic control legacy effects may exist are not known.
In a previous retrospective cohort study, we found that patients with newly diagnosed diabetes and an initial 10-year HbA1c trajectory that was unstable (i.e., changed substantially over time) had an increased risk for future microvascular events, even after adjusting for HbA1c exposure (6). In the same cohort population, this study evaluates associations between the duration and intensity of glycemic control immediately after diagnosis and the long-term incidence of future diabetic complications and mortality. We hypothesized that a glycemic legacy effect exists in real-world populations, begins as early as the 1st year after diabetes diagnosis, and depends on the level of glycemic exposure.”
“RESEARCH DESIGN AND METHODS This cohort study of managed care patients with newly diagnosed type 2 diabetes and 10 years of survival (1997–2013, average follow-up 13.0 years, N = 34,737) examined associations between HbA1c <6.5% (<48 mmol/mol), 6.5% to <7.0% (48 to <53 mmol/mol), 7.0% to <8.0% (53 to <64 mmol/mol), 8.0% to <9.0% (64 to <75 mmol/mol), or ≥9.0% (≥75 mmol/mol) for various periods of early exposure (0–1, 0–2, 0–3, 0–4, 0–5, 0–6, and 0–7 years) and incident future microvascular (end-stage renal disease, advanced eye disease, amputation) and macrovascular (stroke, heart disease/failure, vascular disease) events and death, adjusting for demographics, risk factors, comorbidities, and later HbA1c.
RESULTS Compared with HbA1c <6.5% (<48 mmol/mol) for the 0-to-1-year early exposure period, HbA1c levels ≥6.5% (≥48 mmol/mol) were associated with increased microvascular and macrovascular events (e.g., HbA1c 6.5% to <7.0% [48 to <53 mmol/mol] microvascular: hazard ratio 1.204 [95% CI 1.063–1.365]), and HbA1c levels ≥7.0% (≥53 mmol/mol) were associated with increased mortality (e.g., HbA1c 7.0% to <8.0% [53 to <64 mmol/mol]: 1.290 [1.104–1.507]). Longer periods of exposure to HbA1c levels ≥8.0% (≥64 mmol/mol) were associated with increasing microvascular event and mortality risk.
CONCLUSIONS Among patients with newly diagnosed diabetes and 10 years of survival, HbA1c levels ≥6.5% (≥48 mmol/mol) for the 1st year after diagnosis were associated with worse outcomes. Immediate, intensive treatment for newly diagnosed patients may be necessary to avoid irremediable long-term risk for diabetic complications and mortality.”
Do note that the effect sizes here are very large and this stuff seems really quite important. Judging from the results of this study, if you’re newly diagnosed and you only obtain a HbA1c of say, 7.3% in the first year, that may translate into a close to 30% increased risk of death more than 10 years into the future, compared to a scenario of an HbA1c of 6.3%. People who did not get their HbA1c measured within the first 3 months after diagnosis had a more than 20% increased risk of mortality during the study period. This seems like critical stuff to get right.
…
“Diabetic ketoacidosis (DKA) is a life-threatening complication of type 1 diabetes mellitus (T1DM) that results from absolute insulin deficiency and is marked by acidosis, ketosis, and hyperglycemia (1). Therefore, prevention of DKA is one goal in T1DM care, but recent data indicate increased incidence (2).
For adult patients, only limited data are available on rates and risk factors for development of DKA, and this complication remains epidemiologically poorly characterized. The Diabetes Prospective Follow-up Registry (DPV) has followed patients with diabetes from 1995. Data for this study were collected from 2000 to 2016. Inclusion criteria were diagnosis of T1DM, age at diabetes onset ≥6 months, patient age at follow-up ≥18 years, and diabetes duration ≥1 year to exclude DKA at manifestation. […] In total, 46,966 patients were included in this study (average age 38.5 years [median 21.2], 47.6% female). The median HbA1c was 7.7% (61 mmol/mol), median diabetes duration was 13.6 years, and 58.3% of the patients were treated in large diabetes centers.
On average, 2.5 DKA-related hospital admissions per 100 patient-years (PY) were observed (95% CI 2.1–3.0). The rate was highest in patients aged 18–30 years (4.03/100 PY) and gradually declined with increasing age […] No significant differences between males (2.46/100 PY) and females (2.59/100 PY) were found […] Patients with HbA1c levels <7% (53 mmol/mol) had significantly fewer DKA admissions than patients with HbA1c ≥9% (75 mmol/mol) (0.88/100 PY vs. 6.04/100 PY; P < 0.001)”
“Regarding therapy, use of an insulin pump (continuous subcutaneous insulin infusion [CSII]) was not associated with higher DKA rates […], while patients aged 31–50 years on CSII showed lower rates than patients using multiple daily injections (2.21 vs. 3.12/100 PY; adjusted P < 0.05) […]. Treatment in a large center was associated with lower DKA-related hospital admissions […] In both adults and children, poor metabolic control was the strongest predictor of hospital admission due to DKA. […] In conclusion, the results of this study identify patients with T1DM at risk for DKA (high HbA1c, diabetes duration 5–10 years, migrants, age 30 years and younger) in real-life diabetes care. These at-risk individuals may need specific attention since structured diabetes education has been demonstrated to specifically reduce and prevent this acute complication.”
Viruses
This book is not great, but it’s also not bad – I ended up giving it three stars on goodreads, being much closer to 2 stars than 4. It’s a decent introduction to the field of virology, but not more than that. Below some quotes and links related to the book’s coverage.
…
“[I]t was not until the invention of the electron microscope in 1939 that viruses were first visualized and their structure elucidated, showing them to be a unique class of microbes. Viruses are not cells but particles. They consist of a protein coat which surrounds and protects their genetic material, or, as the famous immunologist Sir Peter Medawar (1915–87) termed it, ‘a piece of bad news wrapped up in protein’. The whole structure is called a virion and the outer coat is called the capsid. Capsids come in various shapes and sizes, each characteristic of the virus family to which it belongs. They are built up of protein subunits called capsomeres and it is the arrangement of these around the central genetic material that determines the shape of the virion. For example, pox viruses are brick-shaped, herpes viruses are icosahedral (twenty-sided spheres), the rabies virus is bullet-shaped, and the tobacco mosaic virus is long and thin like a rod […]. Some viruses have an outer layer surrounding the capsid called an envelope. […] Most viruses are too small to be seen under a light microscope. In general, they are around 100 to 500 times smaller than bacteria, varying in size from 20 to 300 nanometres in diameter […] Inside the virus capsid is its genetic material, or genome, which is either RNA or DNA depending on the type of virus […] Viruses usually have between 4 and 200 genes […] Cells of free-living organisms, including bacteria, contain a variety of organelles essential for life such as ribosomes that manufacture proteins, mitochondria, or other structures that generate energy, and complex membranes for transporting molecules within the cell, and also across the cell wall. Viruses, not being cells, have none of these and are therefore inert until they infect a living cell. Then they hijack a cell’s organelles and use what they need, often killing the cell in the process. Thus viruses are obliged to obtain essential components from other living things to complete their life cycle and are therefore called obligate parasites.”
“Plant viruses either enter cells through a break in the cell wall or are injected by a sap-sucking insect vector like aphids. They then spread very efficiently from cell to cell via plasmodesmata, pores that transport molecules between cells. In contrast, animal viruses infect cells by binding to specific cell surface receptor molecules. […] Once a virus has bound to its cellular receptor, the capsid penetrates the cell and its genome (DNA or RNA) is released into the cell cytoplasm. The main ‘aim’ of a virus is to reproduce successfully, and to do this its genetic material must download the information it carries. Mostly, this will take place in the cell’s nucleus where the virus can access the molecules it needs to begin manufacturing its own proteins. Some large viruses, like pox viruses, carry genes for the enzymes they need to make their proteins and so are more self-sufficient and can complete the whole life cycle in the cytoplasm. Once inside a cell, DNA viruses simply masquerade as pieces of cellular DNA, and their genes are transcribed and translated using as much of the cell’s machinery as they require. […] Because viruses have a high mutation rate, significant evolutionary change, estimated at around 1 per cent per year for HIV, can be measured over a short timescale. […] RNA viruses have no proof-reading system so they have a higher mutation rate than DNA viruses. […] By constantly evolving, […] viruses appear to have honed their skills for spreading from one host to another to reach an amazing degree of sophistication. For instance, the common cold virus (rhinovirus), while infecting cells lining the nasal cavities, tickles nerve endings to cause sneezing. During these ‘explosions’, huge clouds of virus-carrying mucus droplets are forcefully ejected, then float in the air until inhaled by other susceptible hosts. Similarly, by wiping out sheets of cells lining the intestine, rotavirus prevents the absorption of fluids from the gut cavity. This causes severe diarrhea and vomiting that effectively extrudes the virus’s offspring back into the environment to reach new hosts. Other highly successful viruses hitch a ride from one host to another with insects. […] As a virus’s generation time is so much shorter than ours, the evolution of genetic resistance to a new human virus is painfully slow, and constantly leaves viruses with the advantage.”
“The phytoplankton is a group of organisms that uses solar energy and carbon dioxide to generate energy by photosynthesis. As a by-product of this reaction, they produce almost half of the world’s oxygen and are therefore of vital importance to the chemical stability of the planet. Phytoplankton forms the base of the whole marine food-web, being grazed upon by zooplankton and young marine animals which in turn fall prey to fish and higher marine carnivores. By infecting and killing plankton microbes, marine viruses control the dynamics of all these essential populations and their interactions. For example, the common and rather beautiful phytoplankton Emiliania huxleyi regularly undergoes blooms that turn the ocean surface an opaque blue over areas so vast that they can be detected from space by satellites. These blooms disappear as quickly as they arise, and this boom-and-bust cycle is orchestrated by the viruses in the community that specifically infect E. huxleyi. Because they can produce thousands of offspring from every infected cell, virus numbers amplify in a matter of hours and so act as a rapid-response team, killing most of the bloom microbes in just a few days. […] Overall, marine viruses kill an estimated 20-40 per cent of marine bacteria every day, and as the major killer of marine microbes, they profoundly affect the carbon cycle by the so-called ‘viral shunt‘.”
“By the end of 2015 WHO reported 36.7 million people living with HIV globally, 70 per cent of whom are in sub-Saharan Africa. Since the first identification of HIV-induced acquired immunodeficiency syndrome (AIDS) approximately 78 million people have been infected with HIV, causing around 35 million deaths […] Antiviral drugs are key in curtailing HIV spread and are being rolled out worldwide, with present coverage of around 46 per cent of those in need. […] The HIVs are most closely related to primate retroviruses called simian immunodeficiency viruses (SIVs) and it is now clear that these HIV-like viruses have jumped from primates to humans in central Africa on several occasions in the past giving rise to human infections with HIV-1 types M, N, O, and P as well as HIV-2. Yet only one of these viruses, HIV-1 type M, has succeeded in spreading globally. The ancestor of this virus has been traced to a subspecies of chimpanzees (Pan troglodytes troglodytes), among whom it can cause an AIDS-like disease. Since these animals are hunted for bush meat, it is most likely that human infection occurred by blood contamination during the killing and butchering process. This event probably took place in south-east Cameroon where chimpanzees carrying an SIV most closely related to HIV-1 type M live.”
“Flu viruses are paramyxoviruses with an RNA genome with eight genes that are segmented, meaning that instead of being a continuous RNA chain, each gene forms a separate strand. The H (haemaglutinin) and N (neuraminidase) genes are the most important in stimulating protective host immunity. There are sixteen different H and nine different N genes, all of which can be found in all combinations in bird flu viruses. Because these genes are separate RNA strands, on occasions they become mixed up, or recombined. So if two flu A viruses with different H and/or N genes infect a single cell, the offspring will carry varying combinations of genes from the two parent viruses. Most of these viruses will be unable to infect humans, but occasionally a new virus strain is produced that can jump directly to humans and cause a pandemic. […] The emergence of almost all recent novel flu viruses has been traced to China where they circulate freely among animals kept in cramped conditions in farms and live bird markets. […] once established in humans their spread has been much enhanced by travel, particularly air travel that can take a virus inside a traveller across the globe before they even realize they are infected. […] With over a billion people worldwide boarding international flights every year, novel viruses have an efficient mechanism for rapid spread.”
“Once an acute emerging virus such as a new strain of flu is successfully established in a population, it generally settles into a mode of cyclical epidemics during which many susceptible people are infected and become immune to further attack. When most are immune, the virus moves on, only returning when a new susceptible population has emerged, which generally consists of those born since the last epidemic. Before vaccination programmes became widespread, young children suffered from a series of well-recognized infectious diseases called the ‘childhood infections’. These included measles, mumps, rubella, and chickenpox, all caused by viruses […] following the introduction of vaccine programmes these have become a rarity, particularly in the developed world. […] Of the three viruses, measles is the most infectious and produces the severest disease. It killed millions of children each year before vaccination was introduced in the mid-20th century. Even today, this virus kills over 70,000 children annually in countries with low vaccine coverage. […] In developing countries, measles kills 1-5 per cent of those it infects”.
“Smallpox virus is in a class of its own as the world’s worst killer virus. It first infected humans at least 5,000 years ago and killed around 300 million in the 20th century alone. The virus killed up to 30 per cent of those it infected, scarring and blinding many of the survivors. […] Worldwide, eradication of smallpox was declared in 1980.”
“Viruses spread between hosts in many different ways, but those that cause acute epidemics generally utilize fast and efficient methods, such as the airborne or faecal-oral routes. […] Broadly speaking, virus infections are distinguished by the organs they affect, with airborne viruses mainly causing respiratory illnesses, […] and those transmitted by faecal-oral contamination causing intestinal upsets, with nausea, vomiting, and diarrhoea. There are literally thousands of viruses capable of causing human epidemics […] worldwide, acute respiratory infections, mostly viral, cause an estimated four million deaths a year in children under 5. […] Most people get two or three colds a year, suggesting that the immune system, which is so good at protecting us against a second attack of measles, mumps, or rubella, is defeated by the common cold virus. But this is not the case. In fact, there are so many viruses that cause the typical symptoms of blocked nose, headache, malaise, sore throat, sneezing, coughing, and sometimes fever, that even if we live for a hundred years, we will not experience them all. The common cold virus, or rhinovirus, alone has over one hundred different types, and there are many other viruses that infect the cells lining the nose and throat and cause similar symptoms, often with subtle variations. […] Viruses that target the gut are just as diverse as respiratory viruses […] Rotaviruses are a major cause of gastroenteritis globally, particularly targeting children under 5. The disease varies in severity […] rotaviruses cause over 600,000 infant deaths a year worldwide […] Noroviruses are the second most common cause of viral gastroenteritis after rotaviruses, producing a milder disease of shorter duration. These viruses account for around 23 million cases of gastroenteritis every year […] Many virus families such as rotaviruses that rely on faecal-oral transmission and cause gastroenteritis in humans produce the same symptoms in animals, resulting in great economic loss to the farming industry. […] over the centuries, Rinderpest virus, the cause of cattle plague, has probably been responsible for more loss and hardship than any other. […] Rinderpest is classically described by the three Ds: discharge, diarrhoea, and death, the latter being caused by fluid loss with rapid dehydration. The disease kills around 90 per cent of animals infected. Rinderpest used to be a major problem in Europe and Asia, and when it was introduced into Africa in the late 19th century it killed over 90 per cent of cattle, with devastating economic loss. The Global Rinderpest Eradication Programme was set up in the 1980s aiming to use the effective vaccine to rid the world of the virus by 2010. This was successful, and in October 2010 the disease was officially declared eradicated, the first animal disease and second infectious disease ever to be eliminated.”
“At present, 1.8 million virus-associated cancers are diagnosed worldwide annually. This accounts for 18 per cent of all cancers, but since these human tumour viruses were only identified fairly recently, it is probable that there are several more out there waiting to be discovered. […] Primary liver cancer is a major global health problem, being one of the ten most common cancers worldwide, with over 250,000 cases diagnosed every year and only 5 per cent of sufferers surviving five years. The tumour is more common in men than women and is most prevalent in sub-Saharan Africa and South East Asia where the incidence reaches over 30 per 100,000 population per year, compared to fewer than 5 per 100,000 in the USA and Europe. Up to 80 per cent of these tumours are caused by a hepatitis virus, the remainder being related to liver damage from toxic agents such as alcohol. […] hepatitis B and C viruses cause liver cancer. […] a large study carried out on 22,000 men in Taiwan in the 1990s showed that those persistently infected with HBV were over 200 times more likely than non-carriers to develop liver cancer, and that over half the deaths in this group were due to liver cancer or cirrhosis. […] A vaccine against HBV is available, and its use has already caused a decline in HBV-related liver cancer in Taiwan, where a vaccination programme was implemented in the 1980s”.
“Most persistent viruses have evolved to cause mild or even asymptomatic infections, since a life-threatening disease would not only be detrimental to the host but also deprive the virus of its home. Indeed, some viruses apparently cause no ill effects at all, and have been discovered only by chance. One example is TTV, a tiny DNA virus found in 1997 during the search for the cause of hepatitis and named after the initials (TT) of the patient from whom it was first isolated. We now know that TTV, and its relative TTV-like mini virus, represent a whole spectrum of similar viruses that are carried by almost all humans, non-human primates, and a variety of other vertebrates, but so far they have not been associated with any disease. With modern, highly sensitive molecular techniques for identifying non-pathogenic viruses, we can expect to find more of these silent passengers in the future. […] Historically, diagnosis and treatment of virus infections have lagged far behind those of bacterial diseases and are only now catching up. […] Diagnostic laboratories are still unable to find a culprit virus in many so-called ‘viral’ meningitis, encephalitis, and respiratory infections. This strongly suggests that there are many pathogenic viruses waiting to be discovered”.
“There is no doubt that although vaccines are expensive to prepare and test, they are the safest, easiest, and most cost-effective way of controlling infectious diseases worldwide.”
…
Virology. Virus. RNA virus. DNA virus. Retrovirus. Reverse transcriptase. Integrase. Provirus.
Germ theory of disease.
Antonie van Leeuwenhoek. Louis Pasteur. Robert Koch. Adolf Mayer. Dmitri Ivanovsky. Martinus Beijerinck.
Tobacco mosaic virus.
Mimivirus.
Viral evolution – origins.
White spot syndrome.
Fibropapillomatosis.
Acyrthosiphon pisum.
Vibrio_cholerae#Genome (Vibrio cholerae are bacteria, but viruses play a very important role here regarding the toxin-producing genes – “Only cholera bacteria infected with the toxigenic phage are pathogenic to humans”).
Yellow fever.
Dengue fever.
CCR5.
Immune system. Cytokine. Interferon. Macrophage. Lymphocyte. Antigen. CD4++ T cells. CD8+ T-cell. Antibody. Regulatory T cell. Autoimmunity.
Zoonoses.
Arbovirus. Coronavirus. SARS-CoV. MERS-CoV. Ebolavirus. Henipavirus. Influenza virus. H5N1. HPAI. H7N9. Foot-and-mouth disease. Monkeypox virus. Chikungunya virus. Schmallenberg virus. Zika virus. Rift valley fever. Bluetongue disease. Arthrogryposis. West Nile fever. Chickenpox. Polio. Bocavirus.
Sylvatic cycle.
Nosocomial infections.
Subacute sclerosing panencephalitis.
Herpesviridae. CMV. Herpes simplex virus. Epstein–Barr virus. Human herpesvirus 6. Human betaherpesvirus 7. Kaposi’s sarcoma-associated herpesvirus (KSHV). Varicella-zoster virus (VZV). Infectious mononucleosis. Hepatitis. Rous sarcoma virus. Human T-lymphotropic virus. Adult t cell leukemia. HPV. Cervical cancer.
Oncovirus. Myc.
Variolation. Edward Jenner. Mary Wortley Montagu. Benjamin Jesty. James Phipps. Joseph Meister. Jonas Salk. Albert Sabin.
Marek’s disease. Rabies. Post-exposure prophylaxis.
Vaccine.
Aciclovir. Oseltamivir.
PCR.
Random stuff
i. Your Care Home in 120 Seconds. Some quotes:
“In order to get an overall estimate of mental power, psychologists have chosen a series of tasks to represent some of the basic elements of problem solving. The selection is based on looking at the sorts of problems people have to solve in everyday life, with particular attention to learning at school and then taking up occupations with varying intellectual demands. Those tasks vary somewhat, though they have a core in common.
Most tests include Vocabulary, examples: either asking for the definition of words of increasing rarity; or the names of pictured objects or activities; or the synonyms or antonyms of words.
Most tests include Reasoning, examples: either determining which pattern best completes the missing cell in a matrix (like Raven’s Matrices); or putting in the word which completes a sequence; or finding the odd word out in a series.
Most tests include visualization of shapes, examples: determining the correspondence between a 3-D figure and alternative 2-D figures; determining the pattern of holes that would result from a sequence of folds and a punch through folded paper; determining which combinations of shapes are needed to fill a larger shape.
Most tests include episodic memory, examples: number of idea units recalled across two or three stories; number of words recalled from across 1 to 4 trials of a repeated word list; number of words recalled when presented with a stimulus term in a paired-associate learning task.
Most tests include a rather simple set of basic tasks called Processing Skills. They are rather humdrum activities, like checking for errors, applying simple codes, and checking for similarities or differences in word strings or line patterns. They may seem low grade, but they are necessary when we try to organise ourselves to carry out planned activities. They tend to decline with age, leading to patchy, unreliable performance, and a tendency to muddled and even harmful errors. […]
A brain scan, for all its apparent precision, is not a direct measure of actual performance. Currently, scans are not as accurate in predicting behaviour as is a simple test of behaviour. This is a simple but crucial point: so long as you are willing to conduct actual tests, you can get a good understanding of a person’s capacities even on a very brief examination of their performance. […] There are several tests which have the benefit of being quick to administer and powerful in their predictions.[..] All these tests are good at picking up illness related cognitive changes, as in diabetes. (Intelligence testing is rarely criticized when used in medical settings). Delayed memory and working memory are both affected during diabetic crises. Digit Symbol is reduced during hypoglycaemia, as are Digits Backwards. Digit Symbol is very good at showing general cognitive changes from age 70 to 76. Again, although this is a limited time period in the elderly, the decline in speed is a notable feature. […]
The most robust and consistent predictor of cognitive change within old age, even after control for all the other variables, was the presence of the APOE e4 allele. APOE e4 carriers showed over half a standard deviation more general cognitive decline compared to noncarriers, with particularly pronounced decline in their Speed and numerically smaller, but still significant, declines in their verbal memory.
It is rare to have a big effect from one gene. Few people carry it, and it is not good to have.“
…
ii. What are common mistakes junior data scientists make?
Apparently the OP had second thoughts about this query so s/he deleted the question and marked the thread nsfw (??? …nothing remotely nsfw in that thread…). Fortunately the replies are all still there, there are quite a few good responses in the thread. I added some examples below:
“I think underestimating the domain/business side of things and focusing too much on tools and methodology. As a fairly new data scientist myself, I found myself humbled during this one project where I had I spent a lot of time tweaking parameters and making sure the numbers worked just right. After going into a meeting about it became clear pretty quickly that my little micro-optimizations were hardly important, and instead there were X Y Z big picture considerations I was missing in my analysis.”
[…]
-
Forgetting to check how actionable the model (or features) are. It doesn’t matter if you have amazing model for cancer prediction, if it’s based on features from tests performed as part of the post-mortem. Similarly, predicting account fraud after the money has been transferred is not going to be very useful.
-
Emphasis on lack of understanding of the business/domain.
-
Lack of communication and presentation of the impact. If improving your model (which is a quarter of the overall pipeline) by 10% in reducing customer churn is worth just ~100K a year, then it may not be worth putting into production in a large company.
-
Underestimating how hard it is to productionize models. This includes acting on the models outputs, it’s not just “run model, get score out per sample”.
-
Forgetting about model and feature decay over time, concept drift.
-
Underestimating the amount of time for data cleaning.
-
Thinking that data cleaning errors will be complicated.
-
Thinking that data cleaning will be simple to automate.
-
Thinking that automation is always better than heuristics from domain experts.
- Focusing on modelling at the expense of [everything] else”
“unhealthy attachments to tools. It really doesn’t matter if you use R, Python, SAS or Excel, did you solve the problem?”
“Starting with actual modelling way too soon: you’ll end up with a model that’s really good at answering the wrong question.
First, make sure that you’re trying to answer the right question, with the right considerations. This is typically not what the client initially told you. It’s (mainly) a data scientist’s job to help the client with formulating the right question.”
…
iii. Some random wikipedia links: Ottoman–Habsburg wars. Planetshine. Anticipation (genetics). Cloze test. Loop quantum gravity. Implicature. Starfish Prime. Stall (fluid dynamics). White Australia policy. Apostatic selection. Deimatic behaviour. Anti-predator adaptation. Lefschetz fixed-point theorem. Hairy ball theorem. Macedonia naming dispute. Holevo’s theorem. Holmström’s theorem. Sparse matrix. Binary search algorithm. Battle of the Bismarck Sea.
…
iv. 5-HTTLPR: A Pointed Review. This one is hard to quote, you should read all of it. I did however decide to add a few quotes from the post, as well as a few quotes from the comments:
“…what bothers me isn’t just that people said 5-HTTLPR mattered and it didn’t. It’s that we built whole imaginary edifices, whole castles in the air on top of this idea of 5-HTTLPR mattering. We “figured out” how 5-HTTLPR exerted its effects, what parts of the brain it was active in, what sorts of things it interacted with, how its effects were enhanced or suppressed by the effects of other imaginary depression genes. This isn’t just an explorer coming back from the Orient and claiming there are unicorns there. It’s the explorer describing the life cycle of unicorns, what unicorns eat, all the different subspecies of unicorn, which cuts of unicorn meat are tastiest, and a blow-by-blow account of a wrestling match between unicorns and Bigfoot.
This is why I start worrying when people talk about how maybe the replication crisis is overblown because sometimes experiments will go differently in different contexts. The problem isn’t just that sometimes an effect exists in a cold room but not in a hot room. The problem is more like “you can get an entire field with hundreds of studies analyzing the behavior of something that doesn’t exist”. There is no amount of context-sensitivity that can help this. […] The problem is that the studies came out positive when they shouldn’t have. This was a perfectly fine thing to study before we understood genetics well, but the whole point of studying is that, once you have done 450 studies on something, you should end up with more knowledge than you started with. In this case we ended up with less. […] I think we should take a second to remember that yes, this is really bad. That this is a rare case where methodological improvements allowed a conclusive test of a popular hypothesis, and it failed badly. How many other cases like this are there, where there’s no geneticist with a 600,000 person sample size to check if it’s true or not? How many of our scientific edifices are built on air? How many useless products are out there under the guise of good science? We still don’t know.”
A few more quotes from the comment section of the post:
“most things that are obviously advantageous or deleterious in a major way aren’t gonna hover at 10%/50%/70% allele frequency.
Population variance where they claim some gene found in > [non trivial]% of the population does something big… I’ll mostly tend to roll to disbelieve.
But if someone claims a family/village with a load of weirdly depressed people (or almost any other disorder affecting anything related to the human condition in any horrifying way you can imagine) are depressed because of a genetic quirk… believable but still make sure they’ve confirmed it segregates with the condition or they’ve got decent backing.
And a large fraction of people have some kind of rare disorder […]. Long tail. Lots of disorders so quite a lot of people with something odd.
It’s not that single variants can’t have a big effect. It’s that really big effects either win and spread to everyone or lose and end up carried by a tiny minority of families where it hasn’t had time to die out yet.
Very few variants with big effect sizes are going to be half way through that process at any given time.
Exceptions are
1: mutations that confer resistance to some disease as a tradeoff for something else […] 2: Genes that confer a big advantage against something that’s only a very recent issue.”
“I think the summary could be something like:
A single gene determining 50% of the variance in any complex trait is inherently atypical, because variance depends on the population plus environment and the selection for such a gene would be strong, rapidly reducing that variance.
However, if the environment has recently changed or is highly variable, or there is a trade-off against adverse effects it is more likely.
Furthermore – if the test population is specifically engineered to target an observed trait following an apparently Mendelian inheritance pattern – such as a family group or a small genetically isolated population plus controls – 50% of the variance could easily be due to a single gene.”
…
“The most over-used and under-analyzed statement in the academic vocabulary is surely “more research is needed”. These four words, occasionally justified when they appear as the last sentence in a Masters dissertation, are as often to be found as the coda for a mega-trial that consumed the lion’s share of a national research budget, or that of a Cochrane review which began with dozens or even hundreds of primary studies and progressively excluded most of them on the grounds that they were “methodologically flawed”. Yet however large the trial or however comprehensive the review, the answer always seems to lie just around the next empirical corner.
With due respect to all those who have used “more research is needed” to sum up months or years of their own work on a topic, this ultimate academic cliché is usually an indicator that serious scholarly thinking on the topic has ceased. It is almost never the only logical conclusion that can be drawn from a set of negative, ambiguous, incomplete or contradictory data.” […]
“Here is a quote from a typical genome-wide association study:
“Genome-wide association (GWA) studies on coronary artery disease (CAD) have been very successful, identifying a total of 32 susceptibility loci so far. Although these loci have provided valuable insights into the etiology of CAD, their cumulative effect explains surprisingly little of the total CAD heritability.” [1]
The authors conclude that not only is more research needed into the genomic loci putatively linked to coronary artery disease, but that – precisely because the model they developed was so weak – further sets of variables (“genetic, epigenetic, transcriptomic, proteomic, metabolic and intermediate outcome variables”) should be added to it. By adding in more and more sets of variables, the authors suggest, we will progressively and substantially reduce the uncertainty about the multiple and complex gene-environment interactions that lead to coronary artery disease. […] We predict tomorrow’s weather, more or less accurately, by measuring dynamic trends in today’s air temperature, wind speed, humidity, barometric pressure and a host of other meteorological variables. But when we try to predict what the weather will be next month, the accuracy of our prediction falls to little better than random. Perhaps we should spend huge sums of money on a more sophisticated weather-prediction model, incorporating the tides on the seas of Mars and the flutter of butterflies’ wings? Of course we shouldn’t. Not only would such a hyper-inclusive model fail to improve the accuracy of our predictive modeling, there are good statistical and operational reasons why it could well make it less accurate.”
…
vi. Why software projects take longer than you think – a statistical model.
“Anyone who built software for a while knows that estimating how long something is going to take is hard. It’s hard to come up with an unbiased estimate of how long something will take, when fundamentally the work in itself is about solving something. One pet theory I’ve had for a really long time, is that some of this is really just a statistical artifact.
Let’s say you estimate a project to take 1 week. Let’s say there are three equally likely outcomes: either it takes 1/2 week, or 1 week, or 2 weeks. The median outcome is actually the same as the estimate: 1 week, but the mean (aka average, aka expected value) is 7/6 = 1.17 weeks. The estimate is actually calibrated (unbiased) for the median (which is 1), but not for the the mean.
A reasonable model for the “blowup factor” (actual time divided by estimated time) would be something like a log-normal distribution. If the estimate is one week, then let’s model the real outcome as a random variable distributed according to the log-normal distribution around one week. This has the property that the median of the distribution is exactly one week, but the mean is much larger […] Intuitively the reason the mean is so large is that tasks that complete faster than estimated have no way to compensate for the tasks that take much longer than estimated. We’re bounded by 0, but unbounded in the other direction.”
I like this way to conceptually frame the problem, and I definitely do not think it only applies to software development.
“I filed this in my brain under “curious toy models” for a long time, occasionally thinking that it’s a neat illustration of a real world phenomenon I’ve observed. But surfing around on the interwebs one day, I encountered an interesting dataset of project estimation and actual times. Fantastic! […] The median blowup factor turns out to be exactly 1x for this dataset, whereas the mean blowup factor is 1.81x. Again, this confirms the hunch that developers estimate the median well, but the mean ends up being much higher. […]
If my model is right (a big if) then here’s what we can learn:
- People estimate the median completion time well, but not the mean.
- The mean turns out to be substantially worse than the median, due to the distribution being skewed (log-normally).
- When you add up the estimates for n tasks, things get even worse.
- Tasks with the most uncertainty (rather the biggest size) can often dominate the mean time it takes to complete all tasks.”
…
vii. Attraction inequality and the dating economy.
“…the relentless focus on inequality among politicians is usually quite narrow: they tend to consider inequality only in monetary terms, and to treat “inequality” as basically synonymous with “income inequality.” There are so many other types of inequality that get air time less often or not at all: inequality of talent, height, number of friends, longevity, inner peace, health, charm, gumption, intelligence, and fortitude. And finally, there is a type of inequality that everyone thinks about occasionally and that young single people obsess over almost constantly: inequality of sexual attractiveness. […] One of the useful tools that economists use to study inequality is the Gini coefficient. This is simply a number between zero and one that is meant to represent the degree of income inequality in any given nation or group. An egalitarian group in which each individual has the same income would have a Gini coefficient of zero, while an unequal group in which one individual had all the income and the rest had none would have a Gini coefficient close to one. […] Some enterprising data nerds have taken on the challenge of estimating Gini coefficients for the dating “economy.” […] The Gini coefficient for [heterosexual] men collectively is determined by [-ll-] women’s collective preferences, and vice versa. If women all find every man equally attractive, the male dating economy will have a Gini coefficient of zero. If men all find the same one woman attractive and consider all other women unattractive, the female dating economy will have a Gini coefficient close to one.”
“A data scientist representing the popular dating app “Hinge” reported on the Gini coefficients he had found in his company’s abundant data, treating “likes” as the equivalent of income. He reported that heterosexual females faced a Gini coefficient of 0.324, while heterosexual males faced a much higher Gini coefficient of 0.542. So neither sex has complete equality: in both cases, there are some “wealthy” people with access to more romantic experiences and some “poor” who have access to few or none. But while the situation for women is something like an economy with some poor, some middle class, and some millionaires, the situation for men is closer to a world with a small number of super-billionaires surrounded by huge masses who possess almost nothing. According to the Hinge analyst:
On a list of 149 countries’ Gini indices provided by the CIA World Factbook, this would place the female dating economy as 75th most unequal (average—think Western Europe) and the male dating economy as the 8th most unequal (kleptocracy, apartheid, perpetual civil war—think South Africa).”
Btw., I’m reasonably certain “Western Europe” as most people think of it is not average in terms of Gini, and that half-way down the list should rather be represented by some other region or country type, like, say Mongolia or Bulgaria. A brief look at Gini lists seemed to support this impression.
“Quartz reported on this finding, and also cited another article about an experiment with Tinder that claimed that that “the bottom 80% of men (in terms of attractiveness) are competing for the bottom 22% of women and the top 78% of women are competing for the top 20% of men.” These studies examined “likes” and “swipes” on Hinge and Tinder, respectively, which are required if there is to be any contact (via messages) between prospective matches. […] Yet another study, run by OkCupid on their huge datasets, found that women rate 80 percent of men as “worse-looking than medium,” and that this 80 percent “below-average” block received replies to messages only about 30 percent of the time or less. By contrast, men rate women as worse-looking than medium only about 50 percent of the time, and this 50 percent below-average block received message replies closer to 40 percent of the time or higher.
If these findings are to be believed, the great majority of women are only willing to communicate romantically with a small minority of men while most men are willing to communicate romantically with most women. […] It seems hard to avoid a basic conclusion: that the majority of women find the majority of men unattractive and not worth engaging with romantically, while the reverse is not true. Stated in another way, it seems that men collectively create a “dating economy” for women with relatively low inequality, while women collectively create a “dating economy” for men with very high inequality.”
…
I think the author goes a bit off the rails later in the post, but the data is interesting. It’s however important keeping in mind in contexts like these that sexual selection pressures apply at multiple levels, not just one, and that partner preferences can be non-trivial to model satisfactorily; for example as many women have learned the hard way, males may have very different standards for whom to a) ‘engage with romantically’ and b) ‘consider a long-term partner’.
…
viii. Flipping the Metabolic Switch: Understanding and Applying Health Benefits of Fasting.
“Intermittent fasting (IF) is a term used to describe a variety of eating patterns in which no or few calories are consumed for time periods that can range from 12 hours to several days, on a recurring basis. Here we focus on the physiological responses of major organ systems, including the musculoskeletal system, to the onset of the metabolic switch – the point of negative energy balance at which liver glycogen stores are depleted and fatty acids are mobilized (typically beyond 12 hours after cessation of food intake). Emerging findings suggest the metabolic switch from glucose to fatty acid-derived ketones represents an evolutionarily conserved trigger point that shifts metabolism from lipid/cholesterol synthesis and fat storage to mobilization of fat through fatty acid oxidation and fatty-acid derived ketones, which serve to preserve muscle mass and function. Thus, IF regimens that induce the metabolic switch have the potential to improve body composition in overweight individuals. […] many experts have suggested IF regimens may have potential in the treatment of obesity and related metabolic conditions, including metabolic syndrome and type 2 diabetes.(20)”
“In most studies, IF regimens have been shown to reduce overall fat mass and visceral fat both of which have been linked to increased diabetes risk.(139) IF regimens ranging in duration from 8 to 24 weeks have consistently been found to decrease insulin resistance.(12, 115, 118, 119, 122, 123, 131, 132, 134, 140) In line with this, many, but not all,(7) large-scale observational studies have also shown a reduced risk of diabetes in participants following an IF eating pattern.”
“…we suggest that future randomized controlled IF trials should use biomarkers of the metabolic switch (e.g., plasma ketone levels) as a measure of compliance and the magnitude of negative energy balance during the fasting period. It is critical for this switch to occur in order to shift metabolism from lipidogenesis (fat storage) to fat mobilization for energy through fatty acid β-oxidation. […] As the health benefits and therapeutic efficacies of IF in different disease conditions emerge from RCTs, it is important to understand the current barriers to widespread use of IF by the medical and nutrition community and to develop strategies for broad implementation. One argument against IF is that, despite the plethora of animal data, some human studies have failed to show such significant benefits of IF over CR [Calorie Restriction].(54) Adherence to fasting interventions has been variable, some short-term studies have reported over 90% adherence,(54) whereas in a one year ADMF study the dropout rate was 38% vs 29% in the standard caloric restriction group.(135)”
…
ix. Self-repairing cells: How single cells heal membrane ruptures and restore lost structures.
A few diabetes papers of interest
i. Glycemic Control and Risk of Infections Among People With Type 1 or Type 2 Diabetes in a Large Primary Care Cohort Study. From the paper:
“Infections are widely considered to be a source of significant health care costs and to reduce quality of life among people with diabetes mellitus (DM) (1). Nevertheless, relatively few, large, well-designed, epidemiological studies have explored relationships between poorer control of DM and infections; previous studies have important limitations (1). Most randomized controlled trials (RCTs) of DM control have not investigated the effect of improved glycemic control on infections and are unlikely to do so at present because of the high cost and lack of good-quality supporting observational evidence. […] A recent review of higher-quality population-based epidemiological studies found clinically important (∼1.5–3.5 times higher) infection risks associated with poorer DM control in some studies (usually defined as a glycated hemoglobin [HbA1c] level >7–8% [53–64 mmol/mol]) (1). However, the studies were inconsistent, generating uncertainty about the evidence.
A key concern with previous work is that the measurement of HbA1c usually was made at or near to the time of the infection, so any association could be explained by reverse causality. Any infectious disease episode can itself have an adverse effect on glycemic control, a process known as stress hyperglycemia (4); hence, blood glucose or HbA1c measurements near the time of an infection may be elevated, rendering determination of the chronology and relationship between the two difficult. Several studies with serial HbA1c measurements have shown that the stress hyperglycemia response can be substantial (4–6). Another important issue is that studies of incident DM often use measurements of HbA1c obtained during initial presentation, and these typically do not represent subsequent levels after initiation of treatment; use of such measurements may obscure associations between usual HbA1c level and infection risk. Other limitations of previous work include a lack of consideration of type of DM (especially T1DM) and fewer older people with DM. The current study uses a large English primary care database with repeated HbA1c measurements wherein we can classify individuals more precisely in terms of their baseline glycemic control as well as ensure that these HbA1c measurements were made before the infection episode.”
“With the use of English primary care data, average glycated hemoglobin (HbA1c) during 2008–2009 was estimated for 85,312 patients with DM ages 40–89 years. Infection rates during 2010–2015 compiled from primary care, linked hospital, and mortality records were estimated across 18 infection categories and further summarized as any requiring a prescription or hospitalization or as cause of death. Poisson regression was used to estimate adjusted incidence rate ratios (IRRs) by HbA1c categories across all DM, and type 1 and type 2 DM separately. IRRs also were compared with 153,341 age-sex-practice–matched controls without DM. Attributable fractions (AF%) among patients with DM were estimated for an optimal control scenario (HbA1c 6–7% [42–53 mmol/mol]).”
“Crude infection rates during 2010–2015 estimated across 18 different categories confirmed consistently higher rates among patients with DM […]. Long-term infection risk rose with increasing HbA1c for most outcomes. Compared with patients without DM, those with DM and optimal control (HbA1c 6–7% [42–53 mmol/mol], IRR 1.41 [95% CI 1.36–1.47]) and poor control (≥11% [97 mmol/mol], 4.70 [4.24–5.21]) had elevated hospitalization risks for infection. In patients with type 1 DM and poor control, this risk was even greater (IRR 8.47 [5.86–12.24]). Comparisons within patients with DM confirmed the risk of hospitalization with poor control (2.70 [2.43–3.00]) after adjustment for duration and other confounders. AF% of poor control were high for serious infections, particularly bone and joint (46%), endocarditis (26%), tuberculosis (24%), sepsis (21%), infection-related hospitalization (17%), and mortality (16%). […] even patients with DM with good control were at an increased risk compared with matched controls without DM. Thus, compared with patients without DM, patients with DM and good control (mean HbA1c 6–7%, IRR 1.41 [95% CI 1.36–1.47]) and those with poor control (≥11%, 4.70 [4.24–5.21]) had elevated hospitalization risks for infection. These risks were higher among patients with T1DM. For example, patients with T1DM with a mean HbA1c ≥11%, had more than eight times the risk of hospitalization than their matched controls without DM (IRR 8.47 [5.86–12.24]), whereas for T2DM, this was four times higher (4.31 [3.88–4.80]). […] Patients with T1DM […] had higher rates of hospitalization (1.12 [1.01–1.24]) and death as a result of infection (1.42 [1.03–1.96]) than patients with T2DM, even after accounting for duration of DM.”
“In terms of the overall population effect, almost one-half of bone and joint infections among patients with DM were attributed to poor control. […] The most novel and concerning finding is the substantial proportion of other serious infections statistically attributable to poor glycemic control, particularly endocarditis, tuberculosis, and sepsis. Between 20 and 30% of these infections in the English DM population could be attributed to poor control. […] [W]e estimated AF% for the three summary groupings […] plus individual infection types […] across HbA1c categories for patients with DM compared with the optimal control scenario of 6–7%. The largest AF% estimate was for bone and joint infections, with 46.0% of hospitalizations being attributed to HbA1c values outside of the range 6–7%. Other large AF% estimates were observed for endocarditis (26.2%) and tuberculosis (23.7%), but CIs were wide. Sepsis (20.8%), pneumonia (15.3%), skin infections (cellulitis 14.0%, other 12.1%), and candidiasis (16.5%) all produced AF% estimates of ≥10%. Overall, 15.7% of infection-related deaths, 16.5% of infection-related hospitalizations, and 6.8% of infections requiring a prescription were attributed to values of HbA1c outside the 6–7% range.”
“Prevalence of diagnosed T2DM has tripled in the U.K. over the past 20 years (17). Although some improvements in glycemic control also have been observed over this period, our analyses show that substantial numbers of patients still have very poor glycemic control (e.g., 16% of patients with T2DM and 41% of patients with T1DM had a mean HbA1c >9%). […] 14% of patients with DM in the current study were hospitalized for infection during follow-up […] The U.K. has a relatively low prevalence of DM and good control on the basis of international comparisons (18); therefore, in many low- and middle-income countries, the burden of infections attributable to poor glycemic control could be substantially higher (19).”
“A variety of mechanisms may link DM and hyperglycemia with infection response (1,20–22). Diabetes progression itself is associated with immune dysfunction; autoimmunity in T1DM and low-grade chronic inflammation in T2DM (1). Hyperglycemia may also have adverse effects on several types of immune cells (19,23); alter cytokine and chemokine gene expression (24), and inhibit effects of complement (25). Other important mechanisms may include peripheral diabetic neuropathy because this results in a loss of sensation and reduced awareness of minor injuries (13). Alongside ischemia, often as a result of related peripheral arterial disease, neuropathy can result in impaired barrier defenses, skin ulcers, and lesions with poor wound healing and an increased risk of secondary infections (19). Although numerous mechanisms exist, nearly all involve poor glycemic control. Thus, that improved control would reduce infections seems likely […] Overall, the current analyses demonstrate a strong and likely causal association between hyperglycemia and infection risk for both T1DM and T2DM. DM duration and other markers of severity cannot explain the increased risk, nor can longer duration explain the increased risk for T1DM compared with T2DM. This remains the case in older people in whom infections are common and often severe and more uncertainty exists about the vascular benefits of improving DM control. Substantial proportions of serious infections can be attributed to poor control, even though DM is managed well in the U.K. by international standards. Interventions to reduce infection risk largely have been ignored by the DM community and should be a high priority for future research.”
…
ii. Poor Metabolic Control in Children and Adolescents With Type 1 Diabetes and Psychiatric Comorbidity. Some observations from the paper:
“Type 1 diabetes in childhood has been found to be associated with an increased risk of psychiatric comorbidities (1–3), which might intensify the burden of disease and accelerate metabolic deterioration (4–6), subsequently increasing the risk of mortality and long-term complications such as retinopathy, nephropathy, and neuropathy (7–9).
Metabolic dysregulation is closely linked to age and diabetes duration, showing a peak in adolescence and early adulthood (10,11). Early adolescence is also characterized as a time of psychological vulnerability (12), in which the incidence of major psychiatric disorders increases (13). A diagnosis of type 1 diabetes in early adolescence seems to increase psychological distress (1,2), and three large population-based studies have shown higher rates of psychiatric disorders in children and adolescents with type 1 diabetes compared with the general population (1–3). In particular, increased risk was seen for depression, anxiety, and eating disorders, where the pathogenesis is considered to involve reactive mechanisms and imbalances in the diathesis-stress system (1–3,14).”
“Despite clinical and research evidence that a child with type 1 diabetes often receives more than one psychiatric diagnosis (1,3), most studies evaluate one disorder at a time (4–6,16–20). Motivated by findings that Danish children and adolescents with type 1 diabetes have a higher risk of developing a psychiatric disorder compared with the background population (2), we performed two studies based on the NPR and the Danish Registry of Childhood and Adolescent Diabetes (DanDiabKids). […] The NPR contains psychiatric and somatic diagnoses from all inpatient admissions to Danish public hospitals since 1977. […] The register has used the ICD-10 since 1994 (22,23). Data on registration of psychiatric and type 1 diabetes diagnoses were collected from the NPR, covering 1996 to April 2015. DanDiabKids collects information on all children and adolescents diagnosed with type 1 diabetes before the age of 15 years and monitors them until they are transferred to adult clinics at ∼18 years of age. All public hospital pediatric units must supply annual data on all patients with diabetes to DanDiabKids. […] DanDiabKids contains annual data on all registered patients since 1996, including information on quality indicators, demographic variables, associated conditions, diabetes classification, diabetes family history, growth, self-management, and treatment variables. DanDiabKids now covers 99% of all Danish children and adolescents diagnosed with type 1 diabetes before the age of 15 years. […] Our study population was generated by merging data from DanDiabKids and the NPR. The inclusion criteria were registration with type 1 diabetes in DanDiabKids, age at onset <15 years, year of onset 1995–2014, and year of birth after 1980.”
“After merging DanDiabKids with the NPR, 4,725 children and adolescents with type 1 diabetes were identified […]. Characteristics for the included subjects were as follows: mean age at onset of diabetes was 8.98 years (SD 3.81), birth year ranged from 1980 to 2013, mean age at last visit was 14.6 years (3.7), 2,462 (52.1%) were boys, mean duration of diabetes at last visit was 5.65 years (3.7), 4,434 (93.8%) were of Danish origin, 254 (5.4%) were immigrants or offspring of immigrants, and 36 (0.8%) had unknown ethnicity. […] The observed number of SH [severe hypoglycemia, US] and DKA events per 100 person-years was respectively 10.7 (SH) and 3.2 (DKA) in patients with neurodevelopmental/constitutional psychiatric disorder, 12.1 (SH) and 3.7 (DKA) in patients with potentially reactive psychiatric disorder, 12.3 (SH) and 6.4 (DKA) in patients with both types of psychiatric disorders, and 8.1 (SH) and 1.8 (DKA) in patients without psychiatric disorder. […] Among the 4,725 children and adolescents included in the study, 1,035 were diagnosed with at least one psychiatric disorder at some point. Of these, a total of 175 received their first psychiatric diagnosis before the onset of type 1 diabetes, 575 during pediatric care, and 285 were diagnosed after referral to adult care. […] Anxiety disorders were the most common (n = 492), followed by “behavioral and emotional disorders” (n = 310), mood disorders (n = 205), psychoactive substance misuse disorders (n = 190), and disorders of inattention and hyperactivity (ADHD/attention-deficit disorder [ADD]) (n = 172). Of the 1,035 patients, 46% were diagnosed with two or more psychiatric disorders and 22.8% were diagnosed with three or more psychiatric disorders.”
“Shortly after type 1 diabetes diagnosis, a higher estimated risk of psychiatric disorders was evident among patients who were 10–15 years old at onset of type 1 diabetes. However, after 15–20 years with diabetes, the differences among the groups leveled out at a risk of ∼30% […] Children with high mean HbA1c levels (>8.5% [>70 mmol/mol]) during the first 2 years showed the highest estimated risk of developing a psychiatric disorder, although these differences also appear to level out after 15–20 years with type 1 diabetes. […] The mean HbA1c level was higher in children with a psychiatric disorder (0.22% [95% CI 0.15; 0.29]; 2.45 mmol/mol [1.67; 3.22]) compared with children with no psychiatric disorder (P < 0.001) […] High HbA1c levels in the early period after type 1 diabetes onset seem to be a possible indicator for subsequent psychiatric disorders, and having a psychiatric disorder was associated with higher HbA1c levels, especially in patients with disorders of putative reactive pathogenesis. Given that the Kaplan-Meier plots showed that the estimated risk of being diagnosed with a psychiatric disorder within a period of 15–20 years of type 1 diabetes onset was close to 30% in most groups, our finding highlights an important clinical problem.”
“The estimated risk of developing a psychiatric disorder during the 15–20 years after type 1 diabetes diagnosis is high. The most vulnerable period appeared to be adolescence. Patients with poorly regulated diabetes shortly after onset had a higher estimated risk of developing psychiatric comorbidities. Young patients diagnosed with a psychiatric disorder had more episodes of DKA, and those diagnosed within the reactive spectrum had higher HbA1c levels. Children and adolescents with type 1 diabetes, and in particular those who fail to reach treatment goals, should be systematically evaluated regarding psychological vulnerabilities.”
…
“The prevalence of type 1 diabetes has increased over the past decades (1,2). Increased life expectancy means that people live longer with diabetes (3–5); thus, potentially more years are lived with both macrovascular and microvascular complications (6,7). Type 1 diabetes is a complex disease, which develops in various complication states, and co-occurrence of multiple microvascular complications frequently is seen (8). So far, most studies are of a single complication, and the association between the worsening of one complication and the incidence of another is well described, although independently of other complications (9,10). At the same time, a sizeable group of individuals seems to be protected from microvascular complications (11–14), and some live several decades with type 1 diabetes without developing complications. Advanced statistical models, such as multistate models, offer an opportunity to explore the transition through various disease states and to quantify progression rates while considering the concurrent complication burden (15,16), that is, the complication burden at a given time point in the observation window.
Strong evidence indicates that some risk factors play a role in all types of microvascular complications. For example, the effects of the duration of diabetes and poor glycemic control are well documented (17–20). For other risk factors, such as hypertension, an association has been established mainly for retinopathy and diabetic kidney disease (21,22). Adverse cholesterol levels and previous cardiovascular disease (CVD) are indisputably associated with a higher risk of macrovascular complications (23) and may play a role in the development of microvascular complications (24). […] The complex interplay between microvascular complications and risk factors has been explored only to a limited extent. In this study, we developed a multistate model of microvascular complications to describe in detail complication development in type 1 diabetes. We describe the development of sequences of diabetes-related microvascular complications at various states and examine the associations between selected risk factors, both alone and combined with existing complication burden, and incidence of (further) microvascular complications.”
“In total, 5,031 individuals with type 1 diabetes were registered at the SDCC during the study period. We excluded 1,203 because of missing data for diabetic kidney disease, retinopathy, and/or neuropathy, which left 3,828 eligible individuals to be included in the study. Of these, 242 were first seen in the final state with three complications, which left 3,586 available for analysis, corresponding to 22,946 person-years (PY) […] The median follow-up time was 7.8 years (25th–75th percentile 3.3–10.7 years). HbA1c level at the end of follow-up was lower than at entry, whereas the levels of blood pressure, lipids, and BMI were unchanged. An increase in the use of all cardioprotective medications was observed.”
“We identified 523 individuals who developed diabetic kidney disease during the study. Of these, 84 events occurred in individuals with no complications (IR 12.9 per 1,000 PY), 221 in individuals with retinopathy (25.7 per 1,000 PY), 27 in individuals with neuropathy (36.6 per 1,000 PY), and 191 in individuals with both neuropathy and retinopathy (61.8 per 1,000 PY). […] In the adjusted model, individuals with both retinopathy and neuropathy had a threefold higher risk of diabetic kidney disease than individuals without complications. […] A total of 482 individuals developed neuropathy during follow-up. Of these, 75 incidents occurred in individuals with no complications (IR 11.5 per 1,000 PY), 14 in individuals with diabetic kidney disease (20.6 per 1,000 PY), 234 in individuals with retinopathy (27.2 per 1,000 PY), and 159 in individuals with both retinopathy and diabetic kidney disease (50.2 per 1,000 PY). Individuals with both retinopathy and diabetic kidney disease had a 70% higher risk of developing neuropathy than individuals without complications […] In total, we recorded 649 individuals with incident retinopathy from any previous complication state. Of these, 459 incidents occurred in individuals with no complications (IR 70.7 per 1,000 PY), 74 in individuals with diabetic kidney disease (109.1 per 1,000 PY), 71 in individuals with neuropathy (96.6 per 1,000 PY), and 45 in individuals with both neuropathy and diabetic kidney disease (224.7 per 1,000 PY). Individuals with both diabetic kidney disease and neuropathy had a twofold higher IRR of developing retinopathy than individuals without complications”.
“Baseline and concurrent values of HbA1c, systolic blood pressure, eGFR, and baseline CVD status were all strongly associated with a higher risk of developing diabetic kidney disease. […] The analysis that included complication state revealed that individuals without any other complications than CVD had an almost three times higher risk of diabetic kidney disease than individuals without either CVD or microvascular complications. […] Duration of diabetes, baseline and concurrent value of HbA1c, systolic blood pressure, and baseline LDL cholesterol values were all factors associated with a higher risk of developing retinopathy. None of the effects of the modifiable risk factors on retinopathy were modified by complication burden. […] men with diabetic kidney disease had a higher risk of developing retinopathy than women with diabetic kidney disease. […] All investigated risk factors, except LDL cholesterol, were associated with incidence of neuropathy at both baseline and concurrent levels.”
“[W]e conducted a sensitivity analysis with retinopathy defined as severe nonproliferative or proliferative retinopathy. The prevalence and incidence of retinopathy were much lower, but all associations were similar to the main analysis […]. We found no effect modification by lipid-lowering or antihypertensive treatment. […] We found a stepwise higher risk of any microvascular complication in individuals with higher concurrent complication burden. Baseline and concurrent HbA1c levels, systolic blood pressure, and duration of diabetes were associated with the development of all three microvascular complications. For most risk factors, we did not find evidence that concurrent complication burden modified the association with complication development. […] Concurrent HbA1c level was a strong risk factor for all microvascular complications, even when we adjusted for age, duration, and other traditional risk factors. The overall effects were of similar magnitude to the effect of baseline levels of HbA1c and to other reports (11,29).”
“The presented results are interpreted in the frame of a multistate model design, and the use of clinical data makes the results highly relevant in similar health care settings. However, because of the observational study design, we cannot draw conclusions about causality. The positive associations among complications might reflect that diabetic kidney disease takes the longest time to develop, whereas retinopathy and neuropathy develop faster. Associations of two disease complications to a third might not be causal. However, that the risk of a third complication, even after adjustment for multiple confounders, is higher regardless of the previous combination of complications indicates that an association cannot be explained by these risk factors alone. In addition, concurrent risk factor levels may be subject to reverse causality. The current results should be seen as a benchmark for others who aim to explore the occurrence of microvascular complications as a function of the concurrent total complication burden in individuals with type 1 diabetes. […] The findings demonstrate that high concurrent complication burden elevates the risk of all three investigated microvascular complications: diabetic kidney disease, retinopathy, and neuropathy. This means that if an individual develops a complication, the clinician should be aware of the increased risk of developing more complications. […] For most risk factors, including HbA1c, we found no evidence that the effect on the development of microvascular complications was modified by the burden of concurrent complications.”
…
iv. Long-term Glycemic Control and Dementia Risk in Type 1 Diabetes.
“[P]rior work has established type 1 diabetes as a risk factor for dementia (15). However, the relationship between glycemic control and subsequent risk of dementia in those with type 1 diabetes remains unclear. Hemoglobin A1c (HbA1c) is an established measure that integrates glucose control over the prior 2–3 months and is widely used to guide clinical management of type 1 diabetes (16,17). Cumulative glycemic exposure, as measured by multiple HbA1c measures over time, has previously been used to evaluate glycemic trajectories and their association with a number of diabetes complications (18,19). Electronic health records capture HbA1c values collected over time allowing for a more thorough long-term characterization of glycemic exposure than is reflected by a single HbA1c measure. In this study, we leverage data [from northern California, US] collected over a span of 19 years to examine the association of cumulative glycemic exposure, as measured by repeated HbA1c values, with incident dementia among older adults with type 1 diabetes. We also examine the potential for a threshold of glycemic exposure above or below which risk of dementia increases.”
“The final analytic cohort consisted of 3,433 individuals (mean age at cohort entry = 56.1 years old; 47.1% female) […]. On average, individuals who developed dementia during follow-up were older at cohort entry (64.4 vs. 55.7 years) and were more likely to have a history of stroke (7.7% compared with 3.5%) at baseline. The mean follow-up time was 6.3 years (median 4.8 years [interquartile range (IQR) 1.7, 9.9]), and the mean number of HbA1c measurements was 13.5 (median 9.0 [IQR 3.0, 20.00]). By the end of follow-up on 30 September 2015, 155 members (4.5%) were diagnosed with dementia, 860 (25.1%) had a lapse of at least 90 days in membership coverage, 519 (15.1%) died without a dementia diagnosis, and 1,899 (55.3%) were still alive without dementia diagnosis. Among the 155 members who developed dementia over follow-up, the mean age at dementia diagnosis was 64.6 years (median 63.6 years [IQR 56.1, 72.3]).”
“In Cox proportional hazards models, dementia risk was higher in those with increased exposure to HbA1c 8–8.9% (64–74 mmol/mol) and ≥9% (≥75 mmol/mol) and lower in those with HbA1c 6–6.9% (42–52 mmol/mol) and 7–7.9% (53–63 mmol/mol). In fully adjusted models, compared with those with minimal exposure (<10% of HbA1c measurements) to HbA1c 8–8.9% and ≥9%, those with prolonged exposure (≥75% of measurements) were 2.51 and 2.13 times more likely to develop dementia, respectively (HbA1c 8–8.9% fully adjusted hazard ratio [aHR] 2.51 [95% CI 1.23, 5.11] and HbA1c ≥9% aHR 2.13 [95% CI 1.13, 4.01]) […]. In contrast, prolonged exposure to HbA1c 6–6.9 and 7–7.9% was associated with a 58% lower and 61% lower risk of dementia, respectively (HbA1c 6–6.9% aHR 0.42 [95% CI 0.21, 0.83] and HbA1c 7–7.9% aHR 0.39 [95% CI 0.18, 0.83]). […] Results were similar in Cox models examining cumulative glycemic exposure based on whether a majority (>50%) of an individual’s available HbA1c measurements fell into the following categories of HbA1c: <6, 6–6.9, 7–7.9, 8–8.9, and ≥9% […]. Majority exposure to HbA1c 8–8.9 and ≥9% was associated with an increased risk of dementia (HbA1c 8–8.9% aHR 1.65 [95% CI 1.06, 2.57] and HbA1c ≥9% aHR 1.79 [95% CI 1.11, 2.90]), while majority exposure to HbA1c 6–6.9 and 7–7.9% was associated with a reduced risk of dementia (HbA1c 6–6.9% aHR 0.55 [95% CI 0.34, 0.88] and HbA1c 7–7.9% aHR 0.55 [95% CI 0.37, 0.82]). Majority exposure to HbA1c <6% (<42 mmol/mol) was associated with increased dementia risk in age-adjusted models (HR 2.06 [95% CI 1.11, 3.82]), though findings did not remain significant in fully adjusted models (aHR 1.45 [95% CI 0.71, 2.92]). Findings were similar in sensitivity analyses among the subset of members who were ≥65 years of age at baseline (n = 1,082 [32% of the sample]), though the increased risk associated with majority time at HbA1c ≥9% was no longer statistically significant”.
“In this large sample of older adults with type 1 diabetes, we found that cumulative exposure to higher levels of HbA1c (8–8.9 and ≥9%) was associated with an increased risk of dementia, while cumulative exposure to well-controlled HbA1c (6–6.9 and 7–7.9%) was associated with a decreased risk of dementia. In fully adjusted models, compared with those with minimal exposure to HbA1c 8–8.9% and HbA1c ≥9%, those with prolonged exposure were more than twice as likely to develop dementia over the course of follow-up […]. By contrast, dementia risk was ∼60% lower among those with prolonged exposure to well-controlled HbA1c (6–6.9 and 7–7.9%) compared with those with minimal time at well-controlled levels of HbA1c.”
“Our results complement and extend previous studies that have reported an association between chronic hyperglycemia and decreased cognitive function in children and adolescents with type 1 diabetes (25,26), as well as studies reporting an association between poor glycemic control and decreased cognitive functioning in middle-aged adults with type 1 diabetes and older adults with type 2 diabetes (7–11). Our findings are also consistent with previous studies that found an increased dementia risk associated with poorer glycemic control among adults with type 2 diabetes and adults without diabetes (11–13). Whether these findings applied to dementia risk among older adults with type 1 diabetes was previously unknown.”
“In our study of 3,433 older adults with type 1 diabetes, 155 (4.5%) individuals developed dementia over an average of 6.3 years of follow-up. Among those who developed dementia, the average age at dementia diagnosis was 64.6 years. A large-scale study using administrative health data from 1998 to 2011 in England reported a similar incidence of dementia among a subset of adults aged ≥50 years with type 1 diabetes (3.99% developed dementia), though the average length of follow-up was not reported for this specific age-group (15). Prior studies have also found type 1 diabetes to be a risk factor for dementia (15) and have reported the average age at onset of dementia to be 2–5 years earlier in those with diabetes compared with those without diabetes (27,28). Taken together, these results provide further evidence that older adults with type 1 diabetes are at increased risk of developing dementia and may have increased risk at younger ages than the general population. Our results, however, suggest that effective glycemic control could be an important tool for reducing risk of dementia among older adults with type 1 diabetes.”
“Pathophysiological mechanisms by which glycemic control may affect dementia risk are still poorly understood but are hypothesized to result from structural brain abnormalities stemming from chronic exposure to hyperglycemia and/or recurrent severe hypoglycemia. Studies in adults and youth with type 1 diabetes have reported an association between chronic hyperglycemia (defined using lifetime HbA1c history and using retinopathy as an indicator of chronic exposure) and gray matter density loss (35–37). Studies examining the association between severe hypoglycemic events and changes in brain structure have been less consistent, with some reporting increased gray matter density loss and a higher prevalence of cortical atrophy in those with a history of frequent exposure to severe hypoglycemia (36,38), while another study reported no association (37). In the ACCORD MIND (Action to Control Cardiovascular Risk in Diabetes Memory in Diabetes) trial, compared with standard glycemic control, intensive glycemic control was associated with greater total brain volume, suggesting that intensive glycemic control may reduce brain atrophy related to diabetes (39). […] Understanding why glycemic patterns are associated with dementia is a much-needed area for future study, particularly with regard of the potential role of intercurrent micro- and macrovascular complications.”
…
“Hypertension is one of the most common comorbidities among adults with diabetes. Prior studies have estimated the prevalence of hypertension to be twice as high among adults with diabetes compared with age-matched control subjects without diabetes (1,2). Among adults with diabetes, the presence of hypertension has been associated with a two times higher risk for cardiovascular disease (CVD) events and mortality (3,4).
The 2017 American College of Cardiology (ACC)/American Heart Association (AHA) Guideline for the Prevention, Detection, Evaluation, and Management of High Blood Pressure in Adults provides a comprehensive set of recommendations for the diagnosis and treatment of hypertension among adults, including those with diabetes (5). This guideline defines hypertension in adults, including those with diabetes, as an average systolic blood pressure (SBP) ≥130 mmHg or diastolic blood pressure (DBP) ≥80 mmHg […]. According to this guideline, pharmacological antihypertensive treatment should be initiated in adults with diabetes if they have an average SBP ≥130 mmHg or DBP ≥80 mmHg, and the treatment goal is SBP <130 mmHg and DBP <80 mmHg (5).
The American Diabetes Association (ADA) published a position statement on diabetes and hypertension in 2017 that recommends blood pressure (BP) levels different from the ACC/AHA guideline for defining hypertension and for initiating pharmacological antihypertensive treatment (for both, SBP ≥140 mmHg or DBP ≥90 mmHg) (6). The ADA position statement recommends that BP goals should be individualized based on patient priorities and clinician judgment. Treatment goals for those taking antihypertensive medication are SBP <140 mmHg and DBP <90 mmHg, with SBP <130 mmHg and DBP <80 mmHg to be considered for those with high CVD risk as long as these levels can be achieved without undo treatment burden.
The purpose of the current study was to estimate the impact of differences in the definition of hypertension and recommendations for pharmacological antihypertensive treatment initiation and intensification of therapy in U.S. adults with diabetes according to the ACC/AHA guideline and the ADA diabetes and hypertension position statement (5,6). To accomplish these goals, we analyzed data from the U.S. National Health and Nutrition Examination Survey (NHANES).”
“According to data from NHANES 2011–2016, 56.6% (95% CI 53.3, 59.9) of U.S. adults with diabetes were taking antihypertensive medication. Of U.S. adults with diabetes, 57.4% (53.1, 61.6) of those not taking and 80.2% (76.6, 83.4) of those taking antihypertensive medication had high CVD risk. Among U.S. adults with diabetes, those with high CVD risk (history of CVD or 10-year ASCVD risk ≥10%) were on average 15–20 years older and the prevalence of smoking and chronic kidney disease was 10–20% higher when compared with their counterparts without high CVD risk […]. Among U.S. adults with diabetes without high CVD risk, the mean 10-year and 30-year predicted CVD risks were 3.8% (3.5, 4.2) and 25.0% (23.4, 26.6), respectively, for those not taking antihypertensive medication and 5.8% (5.3, 6.4) and 37.4% (34.5, 40.3), respectively, for those taking antihypertensive medication.
The prevalence of hypertension was 77.1% (95% CI 73.9, 80.0) according to the ACC/AHA guideline and 66.3% (63.4, 69.1) according to the ADA position statement […]. Overall, 10.8% (9.0, 12.8) of U.S. adults with diabetes had hypertension according to the ACC/AHA guideline but not the ADA position statement. Among U.S. adults with diabetes not taking antihypertensive medication, 52.8% (47.7, 57.8), 24.8% (20.6, 29.6) and 22.4% (19.2, 25.9) were recommended antihypertensive medication initiation by neither document, by the 2017 ACC/AHA guideline only, and by both documents, respectively […]. Among U.S. adults with diabetes taking antihypertensive medication, 45.3% (41.3, 49.4), 4.3% (2.8, 6.6), and 50.4% (46.5, 54.2) had an average BP that met the goal in both documents, was above the ACC/AHA goal but not the ADA goal, and was above the goals in both documents, respectively […] The overall agreement between the ACC/AHA guideline and the ADA position statement was 89.2% (87.2, 91.0) for the presence of hypertension, 75.2% (70.4, 79.4) for the recommendation to initiate antihypertensive medication, and 95.7% (93.4, 97.2) for having a BP above the recommended treatment goal. “
“Based on both the ACC/AHA guideline and ADA position statement, 17.8 (95% CI 16.2, 19.3) million U.S. adults with diabetes had hypertension […]. An additional 2.9 (2.3, 3.5) million U.S. adults had hypertension based on the ACC/AHA guideline only. Among U.S. adults with diabetes not taking antihypertensive medication, 2.6 (2.1, 3.1) million were recommended to initiate antihypertensive medication by both the ACC/AHA guideline and the ADA position statement with an additional 2.9 (2.3, 3.5) million recommended to initiate antihypertensive medication by the ACC/AHA guideline only […]. Among U.S. adults with diabetes taking antihypertensive medication, 7.6 (6.8, 8.5) million had a BP above the goal in both documents, with an additional 700,000 (400,000, 900,000) having a BP above the goal recommended in the ACC/AHA guideline only […]. Among U.S. adults with diabetes not taking antihypertensive medication, the mean 10-year CVD risk was 10.7% (95% CI 9.4, 12.0) for those not recommended treatment initiation by either the ACC/AHA guideline or the ADA position statement, 14.6% (11.5, 17.6) for those recommended treatment initiation by the ACC/AHA guideline but not the ADA position statement, and 23.2% (19.5, 27.0) among those recommended treatment initiation by the ACC/AHA guideline and the ADA position statement […]. The mean 30-year CVD risk exceeded 25% in each of these groups. Among U.S. adults with diabetes taking antihypertensive medication, the mean 10-year CVD risk was 10.6% (9.4, 12.0), 6.5% (CI 5.6, 7.3), and 33.8% (32.1, 35.5) among those with above-goal BP according to neither document, the ACC/AHA guideline only, and both documents, respectively […]. The 30-year CVD risk exceeded 40% in each group.”
“In conclusion, the current study demonstrates a high degree of concordance between the 2017 ACC/AHA BP guideline and the 2017 ADA position statement on diabetes and hypertension. Using either document, the majority of U.S. adults with diabetes have hypertension. A substantial proportion of U.S. adults with diabetes not taking antihypertensive medication are recommended to initiate treatment by both documents […] Among U.S. adults with diabetes not taking antihypertensive medication, 75.2% had an identical recommendation for initiation of antihypertensive drug therapy according to the ACC/AHA guideline and the ADA position statement. The majority of those who were recommended to initiate pharmacological antihypertensive therapy according to the ACC/AHA guideline but not the ADA position statement had high CVD risk. […] At the population level, the ACC/AHA guideline and ADA position statement have more similarities than differences. However, at the individual level, some patients with diabetes will have fundamental changes in their care depending on which advice is followed. The decision to initiate and intensify antihypertensive medication should always be individualized, based on discussions between patients and their clinicians. Both the ACC/AHA BP guideline and ADA position statement acknowledge the need to individualize treatment decisions to align with patients’ interests.”
…
vi. Treatment-induced neuropathy of diabetes: an acute, iatrogenic complication of diabetes.
“Treatment-induced neuropathy in diabetes (also referred to as insulin neuritis) is considered a rare iatrogenic small fibre neuropathy caused by an abrupt improvement in glycaemic control in the setting of chronic hyperglycaemia. The prevalence and risk factors of this disorder are not known. In a retrospective review of all individuals referred to a tertiary care diabetic neuropathy clinic over 5 years, we define the proportion of individuals that present with and the risk factors for development of treatment-induced neuropathy in diabetes. Nine hundred and fifty-four individuals were evaluated for a possible diabetic neuropathy. Treatment-induced neuropathy in diabetes was defined as the acute onset of neuropathic pain and/or autonomic dysfunction within 8 weeks of a large improvement in glycaemic control—specified as a decrease in glycosylated haemoglobin A1C (HbA1c) of ≥2% points over 3 months. Detailed structured neurologic examinations, glucose control logs, pain scores, autonomic symptoms and other microvascular complications were measured every 3–6 months for the duration of follow-up. Of 954 patients evaluated for diabetic neuropathy, 104/954 subjects (10.9%) met criteria for treatment-induced neuropathy in diabetes with an acute increase in neuropathic or autonomic symptoms or signs coinciding with a substantial decrease in HbA1c. Individuals with a decrease in HbA1c had a much greater risk of developing a painful or autonomic neuropathy than those individuals with no change in HbA1c (P < 0.001), but also had a higher risk of developing retinopathy (P < 0.001) and microalbuminuria (P < 0.001). There was a strong correlation between the magnitude of decrease in HbA1c, the severity of neuropathic pain (R = 0.84, P < 0.001), the degree of parasympathetic dysfunction (R = −0.52, P < 0.01) and impairment of sympathetic adrenergic function as measured by fall in blood pressure on tilt-table testing (R = −0.63, P < 0.001). With a decrease in HbA1c of 2–3% points over 3 months there was a 20% absolute risk of developing treatment-induced neuropathy in diabetes, with a decrease in HbA1c of >4% points over 3 months the absolute risk of developing treatment-induced neuropathy in diabetes exceeded 80%. Treatment-induced neuropathy of diabetes is an underestimated iatrogenic disorder associated with diffuse microvascular complications. Rapid glycaemic change in patients with uncontrolled diabetes increases the risk of this complication.”
“Typically, individuals with TIND reported the onset of severe burning pain (pain scores 4–10/10) within 2–6 weeks of the improvement in glucose control. Burning pain was present in all subjects with TIND. Paraesthesias were present in 93/104 subjects and shooting pain in 88/104 subjects. Hyperalgesia and allodynia were common in the distribution of the pain. […] Individuals with TIND all reported ongoing sleep disturbances typically described as difficulty with sleep initiation and sleep duration secondary to neuropathic pain. These individuals reported no record of sleep problems prior to the development of TIND. […] Erectile dysfunction was noted in 28/31 males with TIND, compared to 135/417 males without TIND (P < 0.001, X2). […] Seventy-three individuals completed autonomic testing within 2–5 months of the onset of neuropathic pain. […] The results for both groups, in all tests, were abnormal compared to age-related normative values. There were strong correlations between the magnitude of decrease in HbA1c over 3 months and worsening autonomic function. A greater change in HbA1c resulted in worsening parasympathetic function as determined by the expiratory to inspiratory ratio (R = −0.52, P < 0.01) and the Valsalva ratio (R = −0.55, P < 0.01). Greater sympathetic adrenergic dysfunction also correlated with a greater change in HbA1c over 3 months as determined by the fall in systolic blood pressure during tilt-table test (R = −0.63, P < 0.001), the fall in blood pressure during phase 2 of the Valsalva manoeuvre (R = 0.49, P < 0.001), and the diminished phase 4 blood pressure overshoot during the Valsalva manoeuvre (R = −0.59, P < 0.001). […] individuals with type 1 diabetes had greater autonomic dysfunction than those with type 2 diabetes across all tests. The slopes of the regression lines describing the correlation between the change in HbA1c and a particular autonomic test did not differ by the type of diabetes, or by the type of treatment used to control glucose.”
“Most patients with TIND had rapid progression of retinopathy that developed in conjunction with the onset of neuropathic pain […] Prior to development of TIND, 65/104 individuals had no retinopathy, 35/104 had non-proliferative retinopathy, whereas 4/104 had proliferative retinopathy. Twelve months after the development of TIND, 10/104 individuals had no retinopathy, 54/104 had non-proliferative retinopathy and 40/104 had proliferative retinopathy (P < 0.001, Fisher’s exact test). Prior to development of TIND, 18/104 had evidence of microalbuminuria, while 12 months after the development of TIND, 87/104 had evidence of microalbuminuria (P < 0.001, X2).”
“TIND is a small fibre and autonomic neuropathy that appears after rapid improvements in glucose control. In this manuscript, we demonstrate that: (i) there is an unexpectedly high proportion of individuals with TIND in a tertiary referral diabetic clinic; (ii) the risk of developing TIND is associated with the magnitude and rate of change in HbA1c; (iii) neuropathic pain and autonomic dysfunction severity correlate with the magnitude of change in HbA1c; (iv) patients with Type 1 diabetes and a history of eating disorders are at high risk for developing TIND; and (v) TIND can occur with use of insulin or oral hypoglycaemic agents. […] TIND differs from the most prevalent generalized neuropathy of diabetes, the distal sensory-motor polyneuropathy, in several respects. The neuropathic pain has an acute onset, appearing within 8 weeks of glycaemic change, in contrast with the more insidious onset in the distal sensory-motor polyneuropathy […]. The pain in TIND is more severe, and poorly responsive to interventions including opioids, whereas most patients with distal sensory-motor polyneuropathy respond to non-opioid interventions […]. Although the distribution of the pain is length-dependent in individuals with TIND, it is frequently far more extensive than in distal sensory-motor polyneuropathy and the associated allodynia and hyperalgesia are much more prevalent […]. Autonomic symptoms and signs are common, prominent and appear acutely, in contrast to the relatively lower prevalence, gradual onset and slow progression in distal sensory-motor polyneuropathy […]. Finally, both the pain and autonomic features may be reversible in some patients […].
Our data indicate that the severity of TIND is associated with the magnitude of the change of HbA1c, however, it is also clear that the rate of change is important (e.g. a 4% point fall in the HbA1c will have a greater impact if occurring over 3 months than over 6 months). The pathogenic mechanisms whereby this change in glucose results in nerve damage and/or dysfunction are not known. Proposed mechanisms include endoneurial ischaemia due to epineurial arterio-venous shunts […], apoptosis due to glucose deprivation […], microvascular neuronal damage due to recurrent hypoglycaemia […], and ectopic firing of regenerating axon sprouts, but these possibilities are unproven. […] Additional mechanistic studies are necessary to determine the underlying pathophysiology.”
Oncology (II)
Here’s my first post in this series. Below some more quotes and links related to the book’s coverage.
…
“Types of Pain
1. Nociceptive pain
a. Somatic pain: Cutaneous or musculoskeletal tissue (ie, bone, soft tissue metastases). Usually well-localized, increased w/use/movement.
b. Visceral pain: Compression, obstruction, infiltration, ischemia, stretching, or inflammation of solid & hollow viscera. Diffuse, nonfocal.
2. Neuropathic pain: Direct injury/dysfunction of peripheral or CNS tissues. Typically burning, radiating, may increase at rest or w/nerve stretching.
Pain emergencies: Pain crisis, spinal cord compression, fracture, bowel obstruction, severe mucositis, acute severe side effects of opioids (addiction crisis, delirium, respiratory depression), severe pain in imminently dying pt [patient, US]
Pain mgmt at the end of life is a moral obligation to alleviate pain & unnecessary suffering & is not euthanasia. (Vacco vs. Quill, U.S. Supreme Court, 1997)”
“Nausea and Vomiting
Chemotherapy-induced N/V — 3 distinct types: Acute, delayed, & anticipatory. Acute begins 1–2 h after chemotherapy & peaks at 4–6 h, delayed begins at 24 h & peaks at 48–72 h, anticipatory is conditioned response to nausea a/w previous cycles of chemotherapy”
“Constipation […] affects 50% of pts w/advanced CA; majority of pts being treated w/opioid analgesics, other contributors: malignant obstruction, ↓ PO/fluid intake, inactivity, anticholinergics, electrolyte derangement”
“Fatigue
Prevalence/screening — occurs in up to 75% of all solid tumor pts & up to 99% of CA pts receiving multimodality Rx. Providers should screen for fatigue at initial visit, at dx [diagnosis, US] of advanced dz [disease] & w/each chemo visit; should assess for depression & insomnia w/new dx of fatigue (JCO 2008;23:3886) […] Several common 2° causes to eval & target include anemia (most common), thyroid or adrenal insufficiency, hypogonadism”
“Delirium
*Definition — disturbances in level of consciousness, attention, cognition, and/or perception developing abruptly w/fluctuations over course of d *Clinical subtypes — hyperactive, hypoactive, & mixed […] *Maximize nonpharm intervention prior to pharmacology […] *Use of antipsychotics should be geared toward short-term use for acute sx [symptoms, US] *Benzodiazepines should only be initiated for delirium as an adjunct to antipsychotics in setting of agitation despite adequate antipsychotic dosing (JCO 2011;30:1206)”
“Cancer Survivorship
Overview *W/improvement in dx & tx of CA, there are millions of CA survivors, & this number is increasing
*Pts experience the normal issues of aging, w/c are compounded by the long-term effects of CA & CA tx
*CA survivors are at ↑ risk of developing morbidity & illnesses at younger age than general population due to their CA tx […] ~312,570 male & ~396,080 female CA survivors <40 y of age (Cancer Treatment and Survivorship Facts and Figures 2016–2017, ACS) *Fertility is an important issue for survivors & there is considerable concern about the possibility of impairment (Human Reproduction Update 2009;15:587)”
“Pts undergoing cancer tx are at ↑ risk for infxn [infection, US] due to disease itself or its therapies. […] *Epidemiology: 10–50% of pts w/ solid tumors & >80% of pts with hematologic tumors *Source of infxn evident in only 20–30% of febrile episodes *If identified, common sites of infxn include blood, lungs, skin, & GI tract *Regardless of microbiologic diagnosis, Rx should be started within 2 h of fever onset which improves outcomes […] [Infections in the transplant host is the] Primary cause of death in 8% of auto-HCT & up to 20% of allo-HCT recipients” [here’s a relevant link, US].
“Localized prostate cancer
*Epidemiology Incidence: ~180000, most common non-skin CA (2016: U.S. est.) (CA Cancer J Clin 2016:66:7) *Annual Mortality: ~26000, 2nd highest cause of cancer death in men (2016: U.S. est) […] Mortality benefit from screening asx [asymptomatic, US] men has not been definitively established, & individualized discussion of potential benefits & harms should occur before PSA testing is offered. […] Gleason grade reflects growth/differentiation pattern & ranges from 1–5, from most to least differentiated. […] Historical (pre-PSA) 15-y prostate CA mortality risk for conservatively managed (no surgery or RT) localized Gleason 6: 18–30%, Gleason 7: 42–70%, Gleason 8–10: 60–87% (JAMA 1998:280:975)”
“Bladder cancer […] Most common malignancy of the urinary system, ~77000 Pts will be diagnosed in the US in 2016, ~16000 will die of their dz. […] Presenting sx: Painless hematuria (typically intermittent & gross), irritative voiding sx (frequency, urgency, dysuria), flank or suprapubic pain (symptomatic of locally advanced dz), constitutional sx (fatigue, wt loss, failure to thrive) usually symptomatic of met [metastatic, US] dz
…
Links:
WHO analgesia ladder. (But see also this – US).
Renal cell carcinoma (“~63000 new cases & ~1400 deaths in the USA in 2016 […] Median age dx 64, more prevalent in men”)
Germ cell tumour (“~8720 new cases of testicular CA in the US in 2016 […] GCT is the most common CA in men ages of 15 to 35 y/o”)
Non-small-cell lung carcinoma (“225K annual cases w/ 160K US deaths, #1 cause of cancer mortality; 70% stage III/IV *Cigarette smoking: 85% of all cases, ↑ w/ intensity & duration of smoking”)
Small-cell lung cancer. (“SCLC accounts for 13–15% of all lung CAs, seen almost exclusively in smokers, majority w/ extensive stage dz at dx (60–70%). Lambert–Eaton myasthenic syndrome (“Affects 3% of SCLC pts”).
Thymoma. Myasthenia gravis. Morvan’s syndrome. Masaoka-Koga Staging system.
Pleural mesothelioma (“Rare; ≅3000 new cases dx annually in US. Commonly develops in the 5th to 7th decade […] About 80% are a/w asbestos exposure. […] Develops decades after asbestos exposure, averaging 30–40 years […] Median survival: 10 mo. […] Screening has not been shown to ↓ mortality even in subjects w/ asbestos exposure”)
Hepatocellular Carcinoma (HCC). (“*6th most common CA worldwide (626,000/y) & 2nd leading cause of worldwide CA mortality (598,000/y) *>80% cases of HCC occur in sub-Saharan Africa, eastern & southeastern Asia, & parts of Oceania including Papua New Guinea *9th leading cause of CA mortality in US […] Viral hepatitis: HBV & HCV are the leading RFs for HCC & accounts for 75% cases worldwide […] While HCV is now the leading cause of HCC in the US, NASH is expected to become a risk factor of increasing importance in the next decade”). Milan criteria.
Cholangiocarcinoma. Klatskin tumor. Gallbladder cancer. Courvoisier’s sign.
Pancreatic cancer (Incidence: estimated ~53,070 new cases/y & ~42,780 D/y in US (NCI SEER); 4th most common cause of CA death in US men & women; estimated to be 2nd leading cause of CA-related mortality by 2020″). Trousseau sign of malignancy. Whipple procedure.
Oncology (I)
I really disliked the ‘Pocket…’ part of this book, so I’ll sort of pretend to overlook this aspect also in my coverage of the book here. This’ll be a hard thing to do, given the way the book is written – I refer to my goodreads review for details, I’ll include only one illustrative quote from that review here:
“In terms of content, the book probably compares favourably with many significantly longer oncology texts (mainly, but certainly not only, because of the publication date). In terms of readability it compares unfavourably to an Egyptian translation of Alan Sokal’s 1996 article in Social Text, if it were translated by a 12-year old dyslexic girl.”
I don’t yet know in how much detail I’ll blog the book; this may end up being the only post about the book, or I may decide to post a longer sequence of posts. The book is hard to blog, which is an argument against covering it in detail – and also the reason why I haven’t already blogged it – but some of the content included in the book is really, really nice stuff to know, which is a strong argument in favour of covering at least some of the material here. The book has a lot of stuff, so regardless of the level of detail of my future coverage a lot of interesting stuff will of necessity have been left out.
My coverage below includes some observations and links related to the first 100 pages of the book.
…
“Understanding Radiation Response: The 4 Rs of Radiobiology
Repair of sublethal damage
Reassortment of cells w/in the cell cycle
Repopulation of cells during the course of radiotherapy
Reoxygenation of hypoxic cells […]
*Oxygen enhances DNA damage induced by free radicals, thereby facilitating the indirect action of IR [ionizing radiation, US] *Biologically equivalent dose can vary by a factor of 2–3 depending upon the presence or absence of oxygen (referred to as the oxygen enhancement ratio) *Poorly oxygenated postoperative beds frequently require higher doses of RT than preoperative RT [radiation therapy] […] Chemotherapy is frequently used sequentially or concurrently w/radiotherapy to maximize therapeutic benefit. This has improved pt outcomes although also a/w ↑ overall tox. […] [Many chemotherapeutic agents] show significant synergy with RT […] Mechanisms for synergy vary widely: Include cell cycle effects, hypoxic cell sensitization, & modulation of the DNA damage response”.
“Specific dose–volume relationships have been linked to the risk of late organ tox. […] *Dose, volume, underlying genetics, and age of the pt at the time of RT are critical determinants of the risk for 2° malignancy *The likelihood of 2° CA is correlated w/dose, but there is no threshold dose below which there is no additional risk of 2° malignancy *Latent period for radiation-induced solid tumors is generally between 10 and 60 y […]. Latent period for leukemias […] is shorter — peak between 5 & 7 y.”
“The immune system plays an important role in CA surveillance; Rx’s that modulate & amplify the immune system are referred to as immunotherapies […] tumors escape the immune system via loss of molecules on tumor cells important for immune activation […]; tumors can secrete immunosuppressing cytokines (IL-10 & TGF-β) & downregulate IFN-γ; in addition, tumors often express nonmutated self-Ag, w/c the immune system will, by definition, not react against; tumors can express molecules that inhibit T-cell function […] Ubiquitous CD47 (Don’t eat me signal) with ↑ expression on tumor cells mediates escape from phagocytosis. *Tumor microenvironment — immune cells are found in tumors, the exact composition of these cells has been a/w [associated with, US] pt outcomes; eg, high concentration of tumor-infiltrating lymphocytes (CD8+ cells) are a/w better outcomes & ↑ response to chemotherapy, Tregs & myeloid-derived suppressor cells are a/w worse outcomes, the exact role of Th17 in tumors is still being elucidated; the milieu of cytokines & chemokines also plays a role in outcome; some cytokines (VEGF, IL-1, IL-8) lead to endothelial cell proliferation, migration, & activation […] Expression of PD-L1 in tumor microenvironment can be indicator of improved likelihood of response to immune checkpoint blockade. […] Tumor mutational load correlates w/increased response to immunotherapy (NEJM; 2014;371:2189.).”
“Over 200 hereditary CA susceptibility syndromes, most are rare […]. Inherited CAs arise from highly penetrant germline mts [mutations, US]; “familial” CAss may be caused by interaction of low-penetrance genes, gene–environment interactions, or both. […] Genetic testing should be done based on individual’s probability of being a mt carrier & after careful discussion & informed consent”.
“Pharmacogenetics: Effect of heritable genes on response to drugs. Study of single genes & interindividual differences in drug metabolizing enzymes. Pharmacogenomics: Effect of inherited & acquired genetic variation on drug response. Study of the functions & interactions of all genes in the genome & how the overall variability of drug response may be used to predict the right tx in individual pts & to design new drugs. Polymorphisms: Common variations in a DNA sequence that may lead to ↓ or ↑ activity of the encoded gene (SNP, micro- & minisatellites). SNPs: Single nucleotide polymorphisms that may cause an amino acid exchange in the encoded protein, account for >90% of genetic variation in the human genome.”
“Tumor lysis syndrome [TLS] is an oncologic emergency caused by electrolyte abnormalities a/w spontaneous and/or tx-induced cell death that can be potentially fatal. […] 4 key electrolyte abnormalities 2° to excessive tumor/cell lysis: *Hyperkalemia *Hyperphosphatemia *Hypocalcemia *Hyperuricemia (2° to catabolism of nucleic acids) […] Common Malignancies Associated with a High Risk of Developing TLS in Adult Patients [include] *Acute leukemias [and] *High-grade lymphomas such as Burkitt lymphoma & DLBCL […] [Disease] characteristics a/w TLS risk: Rapidly progressive, chemosensitive, myelo- or lymphoproliferative [disease] […] [Patient] characteristics a/w TLS risk: *Baseline impaired renal function, oliguria, exposure to nephrotoxins, hyperuricemia *Volume depletion/inadequate hydration, acidic urine”.
“Hypercalcemia [affects] ~10–30% of all pts w/malignancy […] Symptoms: Polyuria/polydipsia, intravascular volume depletion, AKI, lethargy, AMS [Altered Mental Status, US], rarely coma/seizures; N/V [nausea/vomiting, US] […] Osteolytic Bone Lesions [are seen in] ~20% of all hyperCa of malignancy […] [Treat] underlying malignancy, only way to effectively treat, all other tx are temporizing”.
“National Consensus Project definition: Palliative care means patient and family-centered care that optimizes quality of life by anticipating, preventing, and treating suffering. Palliative care throughout the continuum of illness involves addressing physical, intellectual, emotional, social, and spiritual needs to facilitate patient autonomy, access to information, and choice.” […] *Several RCTs have supported the integration of palliative care w/oncologic care, but specific interventions & models of care have varied. Expert panels at NCCN & ASCO recently reviewed the data to release evidence-based guidelines. *NCCN guidelines (2016): “Palliative care should be initiated by the primary oncology team and then augmented by collaboration with an interdisciplinary team of palliative care experts… All cancer patients should be screened for palliative care needs at their initial visit, at appropriate intervals, and as clinically indicated.” *ASCO guideline update (2016): “Inpatients and outpatients with advanced cancer should receive dedicated palliative care services, early in the disease course, concurrent with active tx. Referral of patients to interdisciplinary palliative care teams is optimal […] Essential Components of Palliative Care (ASCO) *Rapport & relationship building w/pts & family caregivers *Symptom, distress, & functional status mgmt (eg, pain, dyspnea, fatigue, sleep disturbance, mood, nausea, or constipation) *Exploration of understanding & education about illness & prognosis *Clarification of tx goals *Assessment & support of coping needs (eg, provision of dignity therapy) *Assistance w/medical decision making *Coordination w/other care providers *Provision of referrals to other care providers as indicated […] Useful Communication Tips *Use open-ended questions to elicit pt concerns *Clarify how much information the pt would like to know […] Focus on what can be done (not just what can’t be done) […] Remove the phrase “do everything” from your medical vocabulary […] Redefine hope by supporting realistic & achievable goals […] make empathy explicit”.
…
Some links:
Radiation therapy.
Brachytherapy.
External beam radiotherapy.
Image-guided radiation therapy.
Stereotactic Radiosurgery.
Total body irradiation.
Cancer stem cell.
Cell cycle.
Carcinogenesis. Oncogene. Tumor suppressor gene. Principles of Cancer Therapy: Oncogene and Non-oncogene Addiction.
Cowden syndrome. Peutz–Jeghers syndrome. Familial Atypical Multiple Mole Melanoma Syndrome. Li–Fraumeni syndrome. Lynch syndrome. Turcot syndrome. Muir–Torre syndrome. Von Hippel–Lindau disease. Gorlin syndrome. Werner syndrome. Birt–Hogg–Dubé syndrome. Neurofibromatosis type I. -ll- type 2.
Knudson hypothesis.
DNA sequencing.
Cytogenetics.
Fluorescence in situ hybridization.
CAR T Cell therapy.
Antimetabolite. Alkylating antineoplastic agent. Antimicrotubule agents/mitotic inhibitors. Chemotherapeutic agents. Topoisomerase inhibitor. Monoclonal antibodies. Bisphosphonates. Proteasome inhibitors. [The book covers all of these agents, and others I for one reason or another decided not to include, in great detail, listing many different types of agents and including notes on dosing, pharmacokinetics & pharmacodynamics, associated adverse events and drug interactions etc. These parts of the book were very interesting, but they are impossible to blog – US).
Syndrome of inappropriate antidiuretic hormone secretion.
Acute lactic acidosis (“Often seen w/liver mets or rapidly dividing heme malignancies […] High mortality despite aggressive tx [treatment]”).
Superior vena cava syndrome.
Circadian Rhythms (II)
Below I have added some more observations from the book, as well as some links of interest.
…
“Most circadian clocks make use of a sun-based mechanism as the primary synchronizing (entraining) signal to lock the internal day to the astronomical day. For the better part of four billion years, dawn and dusk has been the main zeitgeber that allows entrainment. Circadian clocks are not exactly 24 hours. So to prevent daily patterns of activity and rest from drifting (freerunning) over time, light acts rather like the winder on a mechanical watch. If the clock is a few minutes fast or slow, turning the winder sets the clock back to the correct time. Although light is the critical zeitgeber for much behaviour, and provides the overarching time signal for the circadian system of most organisms, it is important to stress that many, if not all cells within an organism possess the capacity to generate a circadian rhythm, and that these independent oscillators are regulated by a variety of different signals which, in turn, drive countless outputs […]. Colin Pittendrigh was one of the first to study entrainment, and what he found in Drosophila has been shown to be true across all organisms, including us. For example, if you keep Drosophila, or a mouse or bird, in constant darkness it will freerun. If you then expose the animal to a short pulse of light at different times the shifting (phase shifting) effects on the freerunning rhythm vary. Light pulses given when the clock ‘thinks’ it is daytime (subjective day) will have little effect on the clock. However, light falling during the first half of the subjective night causes the animal to delay the start of its activity the following day, while light exposure during the second half of the subjective night advances activity onset. Pittendrigh called this the ‘phase response curve’ […] Remarkably, the PRC of all organisms looks very similar, with light exposure around dusk and during the first half of the night causing a delay in activity the next day, while light during the second half of the night and around dawn generates an advance. The precise shape of the PRC varies between species. Some have large delays and small advances (typical of nocturnal species) while others have small delays and big advances (typical of diurnal species). Light at dawn and dusk pushes and pulls the freerunning rhythm towards an exactly 24-hour cycle. […] Light can act directly to modify behaviour. In nocturnal rodents such as mice, light encourages these animals to seek shelter, reduce activity, and even sleep, while in diurnal species light promotes alertness and vigilance. So circadian patterns of activity are not only entrained by dawn and dusk but also driven directly by light itself. This direct effect of light on activity has been called ‘masking’, and combines with the predictive action of the circadian system to restrict activity to that period of the light/dark cycle to which the organism has evolved and is optimally adapted.”
“[B]irds, reptiles, amphibians, and fish (but not mammals) have ‘extra-ocular’ photoreceptors located within the pineal complex, hypothalamus, and other areas of the brain, and like the invertebrates, eye loss in many cases has little impact upon the ability of these animals to entrain. […] Mammals are strikingly different from all other vertebrates as they possess photoreceptor cells only within their eyes. Eye loss in all groups of mammals […] abolishes the capacity of these animals to entrain their circadian rhytms to the light/dark cycle. But astonishingly, the visual cells of the retina – the rods and cones – are not required for the detection of the dawn/dusk signal. There exists a third class of photoreceptors within the eye […] Studies in the late 1990s by Russell Foster and his colleagues showed that mice lacking all their rod and cone photoreceptors could still regulate their circadian rhythms to light perfectly normally. But when their eyes were covered the ability to entrain was lost […] work on the rodless/coneless mouse, along with [other] studies […], clearly demonstrated that the mammalian retina contains a small population of photosensitive retinal ganglion cells or pRGCs, which comprise approximately 1-2 per cent of all retinal ganglion cells […] Ophthalmologists now appreciate that eye loss deprives us of both vision and a proper sense of time. Furthermore, genetic diseases that result in the loss of the rods and cones and cause visual blindness, often spare the pRGCs. Under these circumstances, individuals who have their eyes but are visually blind, yet possess functional pRGCs, need to be advised to seek out sufficient light to entrain their circadian system. The realization that the eye provides us with both our sense of space and our sense of time has redefined the diagnosis, treatment, and appreciation of human blindness.”
“But where is ‘the’ circadian clock of mammals? […] [Robert] Moore and [Irving] Zucker’s work pinpointed the SCN as the likely neural locus of the light-entrainable circadian pacemaker in mammals […] and a decade later this was confirmed by definitive experiments from Michael Menaker’s laboratory undertaken at the University of Virginia. […] These experiments established the SCN as the ‘master circadian pacemaker’ of mammals. […] There are around 20,000 or so neurons in the mouse SCN, but they are not identical. Some receive light information from the pRGCs and pass this information on to other SCN neurons, while others project to the thalamus and other regions of the brain, and collectively these neurons secrete more than one hundred different neurotransmitters, neuropeptides, cytokines, and growth factors. The SCN itself is composed of several regions or clusters of neurons, which have different jobs. Furthermore, there is considerable variability in the oscillations of the individual cells, ranging from 21.25 to 26.25 hours. Although the individual cells in the SCN have their own clockwork mechanisms with varying periods, the cell autonomous oscillations in neural activity are synchronized at the system level within the SCN, providing a coherent near 24-hour signal to the rest of the mammal. […] SCN neurons exhibit a circadian rhythm of spontaneous action potentials (SAPs), with higher frequency during the daytime than the night which in turn drives many rhythmic changes by alternating stimulatory and inhibitory inputs to the appropriate target neurons in the brain and neuroendocrine systems. […] The SCN projects directly to thirty-five brain regions, mostly located in the hypothalamus, and particularly those regions of the hypothalamus that regulate hormone release. Indeed, many pituitary hormones, such as cortisol, are under tight circadian control. Furthermore, the SCN regulates the activity of the autonomous nervous system, which in turn places multiple aspects of physiology, including the sensitivity of target tissues to hormonal signals, under circadian control. In addition to these direct neuronal connections, the SCN communicates to the rest of the body using diffusible chemical signals.”
“The SCN is the master clock in mammals but it is not the only clock. There are liver clocks, muscle clocks, pancreas clocks, adipose tissue clocks, and clocks of some sort in every organ and tissue examined to date. While lesioning of the SCN disrupts global behavioural rhythms such as locomotor activity, the disruption of clock function within just the liver or lung leads to circadian disorder that is confined to the target organ. In tissue culture, liver, heart, lung, skeletal muscle, and other organ tissues such as mammary glands express circadian rhythms, but these rhythms dampen and disappear after only a few cycles. This occurs because some individual clock cells lose rhythmicity, but more commonly because the individual cellular clocks become uncoupled from each other. The cells continue to tick, but all at different phases so that an overall 24-hour rhythm within the tissue or organ is lost. The discovery that virtually all cells of the body have clocks was one of the big surprises in circadian rhythms research. […] the SCN, entrained by pRGCs, acts as a pacemaker to coordinate, but not drive, the circadian activity of billions of individual peripheral circadian oscillators throughout the tissues and organs of the body. The signalling pathways used by the SCN to phase-entrain peripheral clocks are still uncertain, but we know that the SCN does not send out trillions of separate signals around the body that target specific cellular clocks. Rather there seems to be a limited number of neuronal and humoral signals which entrain peripheral clocks that in turn time their local physiology and gene expression.”
“As in Drosophilia […], the mouse clockwork also comprises three transcriptional-translational feedback loops with multiple interacting components. […] [T]he generation of a robust circadian rhythm that can be entrained by the environment is achieved via multiple elements, including the rate of transcription, translation, protein complex assembly, phosphorylation, other post-translation modification events, movement into the nucleus, transcriptional inhibition, and protein degradation. […] [A] complex arrangement is needed because from the moment a gene is switched on, transcription and translation usually takes two hours at most. As a result, substantial delays must be imposed at different stages to produce a near 24-hour oscillation. […] Although the molecular players may differ from Drosophilia and mice, and indeed even between different insects, the underlying principles apply across the spectrum of animal life. […] In fungi, plants, and cyanobacteria the clock genes are all different from each other and different again from the animal clock genes, suggesting that clocks evolved independently in the great evolutionary lineages of life on earth. Despite these differences, all these clocks are based upon a fundamental TTFL.”
“Circadian entrainment is surprisingly slow, taking several days to adjust to an advanced or delayed light/dark cycle. In most mammals, including jet-lagged humans, behavioural shifts are limited to approximately one hour (one time zone) per day. […] Changed levels of PER1 and PER2 act to shift the molecular clockwork, advancing the clock at dawn and delaying the clock at dusk. However, per mRNA and PER protein levels fall rapidly even if the animal remains exposed to light. As a result, the effects of light on the molecular clock are limited and entrainment is a gradual process requiring repeated shifting stimuli over multiple days. This phenomenon explains why we get jet lag: the clock cannot move immediately to a new dawn/dusk cycle because there is a ‘brake’ on the effects of light on the clock. […] The mechanism that provides this molecular brake is the production of SLK1 protein. […] Experiments on mice in which SLK1 has been suppressed show very rapid entrainment to simulated jet-lag.”
“We spend approximately 36 per cent of our entire lives asleep, and while asleep we do not eat, drink, or knowingly pass on our genes. This suggests that this aspect of our 24-hour behaviour provides us with something of huge value. If we are deprived of sleep, the sleep drive becomes so powerful that it can only be satisfied by sleep. […] Almost all life shows a 24-hour pattern of activity and rest, as we live on a planet that revolves once every 24 hours causing profound changes in light, temperature, and food availability. […] Life seems to have made an evolutionary ‘decision’ to be active at a specific part of the day/night cycle, and a species specialized to be active during the day will be far less effective at night. Conversely, nocturnal animals that are beautifully adapted to move around and hunt under dim or no light fail miserably during the day. […] no species can operate with the same effectiveness across the 24-hour light/dark environment. Species are adapted to a particular temporal niche just as they are to a physical niche. Activity at the wrong time often means death. […] Sleep may be the suspension of most physical activity, but a huge amount of essential physiology occurs during this time. Many diverse processes associated with the restoration and rebuilding of metabolic pathways are known to be up-regulated during sleep […] During sleep the body performs a broad range of essential ‘housekeeping’ functions without which performance and health during the active phase deteriorates rapidly. But these housekeeping functions would not be why sleep evolved in the first place. […] Evolution has allocated these key activities to the most appropriate time of day. […] In short, sleep has probably evolved as a species-specific response to a 24-hour world in which light, temperature, and food availability change dramatically. Sleep is a period of physical inactivity when individuals avoid movement within an environment to which they are poorly adapted, while using this time to undertake essential housekeeping functions demanded by their biology.”
“Sleep propensity in humans is closely correlated with the melatonin profile but this may be correlation and not causation. Indeed, individuals who do not produce melatonin (e.g. tetraplegic individuals, people on beta-blockers, or pinealectomized patients) still exhibit circadian sleep/wake rhythms with only very minor detectable changes. Another correlation between melatonin and sleep relates to levels of alertness. When melatonin is suppressed by light at night alertness levels increase, suggesting that melatonin and sleep propensity are directly connected. However, increases in alertness occur before a significant drop in blood melatonin. Furthermore, increased light during the day will also improve alertness when melatonin levels are already low. These findings suggest that melatonin is not a direct mediator of alertness and hence sleepiness. Taking synthetic melatonin or synthetic analogues of melatonin produces a mild sleepiness in about 70 per cent of people, especially when no natural melatonin is being released. The mechanism whereby melatonin produces mild sedation remains unclear.”
…
Links:
Teleost multiple tissue (tmt) opsin.
Melanopsin.
Suprachiasmatic nucleus.
Neuromedin S.
Food-entrainable circadian oscillators in the brain.
John Harrison. Seymour Benzer. Ronald Konopka. Jeffrey C. Hall. Michael Rosbash. Michael W. Young.
Circadian Oscillators: Around the Transcription-Translation Feedback Loop and on to Output.
Period (gene). Timeless (gene). CLOCK. Cycle (gene). Doubletime (gene). Cryptochrome. Vrille Gene.
Basic helix-loop-helix.
The clockwork orange Drosophila protein functions as both an activator and a repressor of clock gene expression.
RAR-related orphan receptor. RAR-related orphan receptor alpha.
BHLHE41.
The two-process model of sleep regulation: a reappraisal.
A few diabetes papers of interest
i. Islet Long Noncoding RNAs: A Playbook for Discovery and Characterization.
“This review will 1) highlight what is known about lncRNAs in the context of diabetes, 2) summarize the strategies used in lncRNA discovery pipelines, and 3) discuss future directions and the potential impact of studying the role of lncRNAs in diabetes.”
“Decades of mouse research and advances in genome-wide association studies have identified several genetic drivers of monogenic syndromes of β-cell dysfunction, as well as 113 distinct type 2 diabetes (T2D) susceptibility loci (1) and ∼60 loci associated with an increased risk of developing type 1 diabetes (T1D) (2). Interestingly, these studies discovered that most T1D and T2D susceptibility loci fall outside of coding regions, which suggests a role for noncoding elements in the development of disease (3,4). Several studies have demonstrated that many causal variants of diabetes are significantly enriched in regions containing islet enhancers, promoters, and transcription factor binding sites (5,6); however, not all diabetes susceptibility loci can be explained by associations with these regulatory regions. […] Advances in RNA sequencing (RNA-seq) technologies have revealed that mammalian genomes encode tens of thousands of RNA transcripts that have similar features to mRNAs, yet are not translated into proteins (7). […] detailed characterization of many of these transcripts has challenged the idea that the central role for RNA in a cell is to give rise to proteins. Instead, these RNA transcripts make up a class of molecules called noncoding RNAs (ncRNAs) that function either as “housekeeping” ncRNAs, such as transfer RNAs (tRNAs) and ribosomal RNAs (rRNAs), that are expressed ubiquitously and are required for protein synthesis or as “regulatory” ncRNAs that control gene expression. While the functional mechanisms of short regulatory ncRNAs, such as microRNAs (miRNAs), small interfering RNAs (siRNAs), and Piwi-interacting RNAs (piRNAs), have been described in detail (8–10), the most abundant and functionally enigmatic regulatory ncRNAs are called long noncoding RNAs (lncRNAs) that are loosely defined as RNAs larger than 200 nucleotides (nt) that do not encode for protein (11–13). Although using a definition based strictly on size is somewhat arbitrary, this definition is useful both bioinformatically […] and technically […]. While the 200-nt size cutoff has simplified identification of lncRNAs, this rather broad classification means several features of lncRNAs, including abundance, cellular localization, stability, conservation, and function, are inherently heterogeneous (15–17). Although this represents one of the major challenges of lncRNA biology, it also highlights the untapped potential of lncRNAs to provide a novel layer of gene regulation that influences islet physiology and pathophysiology.”
“Although the role of miRNAs in diabetes has been well established (9), analyses of lncRNAs in islets have lagged behind their short ncRNA counterparts. However, several recent studies provide evidence that lncRNAs are crucial components of the islet regulome and may have a role in diabetes (27). […] misexpression of several lncRNAs has been correlated with diabetes complications, such as diabetic nephropathy and retinopathy (29–31). There are also preliminary studies suggesting that circulating lncRNAs, such as Gas5, MIAT1, and SENCR, may represent effective molecular biomarkers of diabetes and diabetes-related complications (32,33). Finally, several recent studies have explored the role of lncRNAs in the peripheral metabolic tissues that contribute to energy homeostasis […]. In addition to their potential as genetic drivers and/or biomarkers of diabetes and diabetes complications, lncRNAs can be exploited for the treatment of diabetes. For example, although tremendous efforts have been dedicated to generating replacement β-cells for individuals with diabetes (35,36), human pluripotent stem cell–based β-cell differentiation protocols remain inefficient, and the end product is still functionally and transcriptionally immature compared with primary human β-cells […]. This is largely due to our incomplete knowledge of in vivo differentiation regulatory pathways, which likely include a role for lncRNAs. […] Inherent characteristics of lncRNAs have also made them attractive candidates for drug targeting, which could be exploited for developing new diabetes therapies.”
“With the advancement of high-throughput sequencing techniques, the list of islet-specific lncRNAs is growing exponentially; however, functional characterization is missing for the majority of these lncRNAs. […] Tens of thousands of lncRNAs have been identified in different cell types and model organisms; however, their functions largely remain unknown. Although the tools for determining lncRNA function are technically restrictive, uncovering novel regulatory mechanisms will have the greatest impact on understanding islet function and identifying novel therapeutics for diabetes. To date, no biochemical assay has been used to directly determine the molecular mechanisms by which islet lncRNAs function, which highlights both the infancy of the field and the difficulty in implementing these techniques. […] Due to the infancy of the lncRNA field, most of the biochemical and genetic tools used to interrogate lncRNA function have only recently been developed or are adapted from techniques used to study protein-coding genes and we are only beginning to appreciate the limits and challenges of borrowing strategies from the protein-coding world.”
“The discovery of lncRNAs as a novel class of tissue-specific regulatory molecules has spawned an exciting new field of biology that will significantly impact our understanding of pancreas physiology and pathophysiology. As the field continues to grow, there is growing appreciation that lncRNAs will provide many of the missing components to existing molecular pathways that regulate islet biology and contribute to diabetes when they become dysfunctional. However, to date, most of the experimental emphasis on lncRNAs has focused on large-scale discovery using genome-wide approaches, and there remains a paucity of functional analysis.”
…
“Diabetes is among the strongest common risk factors for end-stage renal disease, and in industrialized countries, diabetes contributes to ∼50% of cases (3). Less is known about the pattern of kidney function decline associated with diabetes that precedes end-stage renal disease. Identifying patterns of estimated glomerular filtration rate (eGFR) decline could inform monitoring practices for people at high risk of chronic kidney disease (CKD) progression. A better understanding of when and in whom eGFR decline occurs would be useful for the design of clinical trials because eGFR decline >30% is now often used as a surrogate end point for CKD progression (4). Trajectories among persons with diabetes are of particular interest because of the possibility for early intervention and the prevention of CKD development. However, eGFR trajectories among persons with new diabetes may be complex due to the hypothesized period of hyperfiltration by which GFR increases, followed by progressive, rapid decline (5). Using data from the Atherosclerosis Risk in Communities (ARIC) study, an ongoing prospective community-based cohort of >15,000 participants initiated in 1987 with serial measurements of creatinine over 26 years, our aim was to characterize patterns of eGFR decline associated with diabetes, identify demographic, genetic, and modifiable risk factors within the population with diabetes that were associated with steeper eGFR decline, and assess for evidence of early hyperfiltration.”
“We categorized people into groups of no diabetes, undiagnosed diabetes, and diagnosed diabetes at baseline (visit 1) and compared baseline clinical characteristics using ANOVA for continuous variables and Pearson χ2 tests for categorical variables. […] To estimate individual eGFR slopes over time, we used linear mixed-effects models with random intercepts and random slopes. These models were fit on diabetes status at baseline as a nominal variable to adjust the baseline level of eGFR and included an interaction term between diabetes status at baseline and time to estimate annual decline in eGFR by diabetes categories. Linear mixed models were run unadjusted and adjusted, with the latter model including the following diabetes and kidney disease–related risk factors: age, sex, race–center, BMI, systolic blood pressure, hypertension medication use, HDL, prevalent coronary heart disease, annual family income, education status, and smoking status, as well as each variable interacted with time. Continuous covariates were centered at the analytic population mean. We tested model assumptions and considered different covariance structures, comparing nested models using Akaike information criteria. We identified the unstructured covariance model as the most optimal and conservative approach. From the mixed models, we described the overall mean annual decline by diabetes status at baseline and used the random effects to estimate best linear unbiased predictions to describe the distributions of yearly slopes in eGFR by diabetes status at baseline and displayed them using kernel density plots.”
“Because of substantial variation in annual eGFR slope among people with diagnosed diabetes, we sought to identify risk factors that were associated with faster decline. Among those with diagnosed diabetes, we compared unadjusted and adjusted mean annual decline in eGFR by race–APOL1 risk status (white, black– APOL1 low risk, and black–APOL1 high risk) [here’s a relevant link, US], systolic blood pressure […], smoking status […], prevalent coronary heart disease […], diabetes medication use […], HbA1c […], and 1,5-anhydroglucitol (≥10 and <10 μg/mL) [relevant link, US]. Because some of these variables were only available at visit 2, we required that participants included in this subgroup analysis attend both visits 1 and 2 and not be missing information on APOL1 or the variables assessed at visit 2 to ensure a consistent sample size. In addition to diabetes and kidney disease–related risk factors in the adjusted model, we also included diabetes medication use and HbA1c to account for diabetes severity in these analyses. […] to explore potential hyperfiltration, we used a linear spline model to allow the slope to change for each diabetes category between the first 3 years of follow-up (visit 1 to visit 2) and the subsequent time period (visit 2 to visit 5).”
“There were 15,517 participants included in the analysis: 13,698 (88%) without diabetes, 634 (4%) with undiagnosed diabetes, and 1,185 (8%) with diagnosed diabetes at baseline. […] At baseline, participants with undiagnosed and diagnosed diabetes were older, more likely to be black or have hypertension and coronary heart disease, and had higher mean BMI and lower mean HDL compared with those without diabetes […]. Income and education levels were also lower among those with undiagnosed and diagnosed diabetes compared with those without diabetes. […] Overall, there was a nearly linear association between eGFR and age over time, regardless of diabetes status […]. The crude mean annual decline in eGFR was slowest among those without diabetes at baseline (decline of −1.6 mL/min/1.73 m2/year [95% CI −1.6 to −1.5]), faster among those with undiagnosed diabetes compared with those without diabetes (decline of −2.1 mL/min/1.73 m2/year [95% CI −2.2 to −2.0][…]), and nearly twice as rapid among those with diagnosed diabetes compared with those without diabetes (decline of −2.9 mL/min/1.73 m2/year [95% CI −3.0 to −2.8][…]). Adjustment for diabetes and kidney disease–related risk factors attenuated the results slightly, but those with undiagnosed and diagnosed diabetes still had statistically significantly steeper declines than those without diabetes (decline among no diabetes −1.4 mL/min/1.73 m2/year [95% CI −1.5 to −1.4] and decline among undiagnosed diabetes −1.8 mL/min/1.73 m2/year [95% CI −2.0 to −1.7], difference vs. no diabetes of −0.4 mL/min/1.73 m2/year [95% CI −0.5 to −0.3; P < 0.001]; decline among diagnosed diabetes −2.5 mL/min/1.73 m2/year [95% CI −2.6 to −2.4], difference vs. no diabetes of −1.1 mL/min/1.73 m2/ year [95% CI −1.2 to −1.0; P < 0.001]). […] The decline in eGFR per year varied greatly across individuals, particularly among those with diabetes at baseline […] Among participants with diagnosed diabetes at baseline, those who were black, had systolic blood pressure ≥140 mmHg, used diabetes medications, had an HbA1c ≥7% [≥53 mmol/mol], or had 1,5-anhydroglucitol <10 μg/mL were at risk for steeper annual declines than their counterparts […]. Smoking status and prevalent coronary heart disease were not associated with significantly steeper eGFR decline in unadjusted analyses. Adjustment for risk factors, diabetes medication use, and HbA1c attenuated the differences in decline for all subgroups with the exception of smoking status, leaving black race along with APOL1-susceptible genotype, systolic blood pressure ≥140 mmHg, current smoking, insulin use, and HbA1c ≥9% [≥75 mmol/mol] as the risk factors indicative of steeper decline.”
“CONCLUSIONS Diabetes is an important risk factor for kidney function decline. Those with diagnosed diabetes declined almost twice as rapidly as those without diabetes. Among people with diagnosed diabetes, steeper declines were seen in those with modifiable risk factors, including hypertension and glycemic control, suggesting areas for continued targeting in kidney disease prevention. […] Few other community-based studies have evaluated differences in kidney function decline by diabetes status over a long period through mid- and late life. One study of 10,184 Canadians aged ≥66 years with creatinine measured during outpatient visits showed results largely consistent with our findings but with much shorter follow-up (median of 2 years) (19). Other studies of eGFR change in a general population have found smaller declines than our results (20,21). A study conducted in Japanese participants aged 40–79 years found a decline of only −0.4 mL/min/1.73 m2/year over the course of two assessments 10 years apart (compared with our estimate among those without diabetes: −1.6 mL/min/1.73 m2/year). This is particularly interesting, as Japan is known to have a higher prevalence of CKD and end-stage renal disease than the U.S. (20). However, this study evaluated participants over a shorter time frame and required attendance at both assessments, which may have decreased the likelihood of capturing severe cases and resulted in underestimation of decline.”
“The Baltimore Longitudinal Study of Aging also assessed kidney function over time in a general population of 446 men, ranging in age from 22 to 97 years at baseline, each with up to 14 measurements of creatinine clearance assessed between 1958 and 1981 (21). They also found a smaller decline than we did (−0.8 mL/min/year), although this study also had notable differences. Their main analysis excluded participants with hypertension and history of renal disease or urinary tract infection and those treated with diuretics and/or antihypertensive medications. Without those exclusions, their overall estimate was −1.1 mL/min/year, which better reflects a community-based population and our results. […] In our evaluation of risk factors that might explain the variation in decline seen among those with diagnosed diabetes, we observed that black race, systolic blood pressure ≥140 mmHg, insulin use, and HbA1c ≥9% (≥75 mmol/mol) were particularly important. Although the APOL1 high-risk genotype is a known risk factor for eGFR decline, African Americans with low-risk APOL1 status continued to be at higher risk than whites even after adjustment for traditional risk factors, diabetes medication use, and HbA1c.”
“Our results are relevant to the design and conduct of clinical trials. Hard clinical outcomes like end-stage renal disease are relatively rare, and a 30–40% decline in eGFR is now accepted as a surrogate end point for CKD progression (4). We provide data on patient subgroups that may experience accelerated trajectories of kidney function decline, which has implications for estimating sample size and ensuring adequate power in future clinical trials. Our results also suggest that end points of eGFR decline might not be appropriate for patients with new-onset diabetes, in whom declines may actually be slower than among persons without diabetes. Slower eGFR decline among those with undiagnosed diabetes, who are likely early in the course of diabetes, is consistent with the hypothesis of hyperfiltration. Similar to other studies, we found that persons with undiagnosed diabetes had higher GFR at the outset, but this was a transient phenomenon, as they ultimately experienced larger declines in kidney function than those without diabetes over the course of follow-up (23–25). Whether hyperfiltration is a universal aspect of early disease and, if not, whether it portends worse long-term outcomes is uncertain. Existing studies investigating hyperfiltration as a precursor to adverse kidney outcomes are inconsistent (24,26,27) and often confounded by diabetes severity factors like duration (27). We extended this literature by separating undiagnosed and diagnosed diabetes to help address that confounding.”
…
“OBJECTIVE Nonalcoholic fatty liver disease (i.e., increased intrahepatic triglyceride [IHTG] content), predisposes to type 2 diabetes and cardiovascular disease. Adipose tissue lipolysis and hepatic de novo lipogenesis (DNL) are the main pathways contributing to IHTG. We hypothesized that dietary macronutrient composition influences the pathways, mediators, and magnitude of weight gain-induced changes in IHTG.
RESEARCH DESIGN AND METHODS We overfed 38 overweight subjects (age 48 ± 2 years, BMI 31 ± 1 kg/m2, liver fat 4.7 ± 0.9%) 1,000 extra kcal/day of saturated (SAT) or unsaturated (UNSAT) fat or simple sugars (CARB) for 3 weeks. We measured IHTG (1H-MRS), pathways contributing to IHTG (lipolysis ([2H5]glycerol) and DNL (2H2O) basally and during euglycemic hyperinsulinemia), insulin resistance, endotoxemia, plasma ceramides, and adipose tissue gene expression at 0 and 3 weeks.
RESULTS Overfeeding SAT increased IHTG more (+55%) than UNSAT (+15%, P < 0.05). CARB increased IHTG (+33%) by stimulating DNL (+98%). SAT significantly increased while UNSAT decreased lipolysis. SAT induced insulin resistance and endotoxemia and significantly increased multiple plasma ceramides. The diets had distinct effects on adipose tissue gene expression.”
“CONCLUSIONS NAFLD has been shown to predict type 2 diabetes and cardiovascular disease in multiple studies, even independent of obesity (1), and also to increase the risk of progressive liver disease (17). It is therefore interesting to compare effects of different diets on liver fat content and understand the underlying mechanisms. We examined whether provision of excess calories as saturated (SAT) or unsaturated (UNSAT) fats or simple sugars (CARB) influences the metabolic response to overfeeding in overweight subjects. All overfeeding diets increased IHTGs. The SAT diet induced a greater increase in IHTGs than the UNSAT diet. The composition of the diet altered sources of excess IHTGs. The SAT diet increased lipolysis, whereas the CARB diet stimulated DNL. The SAT but not the other diets increased multiple plasma ceramides, which increase the risk of cardiovascular disease independent of LDL cholesterol (18). […] Consistent with current dietary recommendations (36–38), the current study shows that saturated fat is the most harmful dietary constituent regarding IHTG accumulation.”
…
iv. Primum Non Nocere: Refocusing Our Attention on Severe Hypoglycemia Prevention.
“Severe hypoglycemia, defined as low blood glucose requiring assistance for recovery, is arguably the most dangerous complication of type 1 diabetes as it can result in permanent cognitive impairment, seizure, coma, accidents, and death (1,2). Since the Diabetes Control and Complications Trial (DCCT) demonstrated that intensive intervention to normalize glucose prevents long-term complications but at the price of a threefold increase in the rate of severe hypoglycemia (3), hypoglycemia has been recognized as the major limitation to achieving tight glycemic control. Severe hypoglycemia remains prevalent among adults with type 1 diabetes, ranging from ∼1.4% per year in the DCCT/EDIC (Epidemiology of Diabetes Interventions and Complications) follow-up cohort (4) to ∼8% in the T1D Exchange clinic registry (5).
One the greatest risk factors for severe hypoglycemia is impaired awareness of hypoglycemia (6), which increases risk up to sixfold (7,8). Hypoglycemia unawareness results from deficient counterregulation (9), where falling glucose fails to activate the autonomic nervous system to produce neuroglycopenic symptoms that normally help patients identify and respond to episodes (i.e., sweating, palpitations, hunger) (2). An estimated 20–25% of adults with type 1 diabetes have impaired hypoglycemia awareness (8), which increases to more than 50% after 25 years of disease duration (10).
Screening for hypoglycemia unawareness to identify patients at increased risk of severe hypoglycemic events should be part of routine diabetes care. Self-identified impairment in awareness tends to agree with clinical evaluation (11). Therefore, hypoglycemia unawareness can be easily and effectively screened […] Interventions for hypoglycemia unawareness include a range of behavioral and medical options. Avoiding hypoglycemia for at least several weeks may partially reverse hypoglycemia unawareness and reduce risk of future episodes (1). Therefore, patients with hypoglycemia and unawareness may be advised to raise their glycemic and HbA1c targets (1,2). Diabetes technology can play a role, including continuous subcutaneous insulin infusion (CSII) to optimize insulin delivery, continuous glucose monitoring (CGM) to give technological awareness in the absence of symptoms (14), or the combination of the two […] Aside from medical management, structured or hypoglycemia-specific education programs that aim to prevent hypoglycemia are recommended for all patients with severe hypoglycemia or hypoglycemia unawareness (14). In randomized trials, psychoeducational programs that incorporate increased education, identification of personal risk factors, and behavior change support have improved hypoglycemia unawareness and reduced the incidence of both nonsevere and severe hypoglycemia over short periods of follow-up (17,18) and extending up to 1 year (19).”
“Given that the presence of hypoglycemia unawareness increases the risk of severe hypoglycemia, which is the strongest predictor of a future episode (2,4), the implication that intervention can break the life-threatening and traumatizing cycle of hypoglycemia unawareness and severe hypoglycemia cannot be overstated. […] new evidence of durability of effect across treatment regimen without increasing the risk for long-term complications creates an imperative for action. In combination with existing screening tools and a body of literature investigating novel interventions for hypoglycemia unawareness, these results make the approach of screening, recognition, and intervention very compelling as not only a best practice but something that should be incorporated in universal guidelines on diabetes care, particularly for individuals with type 1 diabetes […] Hyperglycemia is […] only part of the puzzle in diabetes management. Long-term complications are decreasing across the population with improved interventions and their implementation (24). […] it is essential to shift our historical obsession with hyperglycemia and its long-term complications to equally emphasize the disabling, distressing, and potentially fatal near-term complication of our treatments, namely severe hypoglycemia. […] The health care providers’ first dictum is primum non nocere — above all, do no harm. ADA must refocus our attention on severe hypoglycemia as an iatrogenic and preventable complication of our interventions.”
…
“Background
The combination of steroid and anti‐vascular endothelial growth factor (VEGF) intravitreal therapeutic agents could potentially have synergistic effects for treating diabetic macular oedema (DMO). On the one hand, if combined treatment is more effective than monotherapy, there would be significant implications for improving patient outcomes. Conversely, if there is no added benefit of combination therapy, then people could be potentially exposed to unnecessary local or systemic side effects.
Objectives
To assess the effects of intravitreal agents that block vascular endothelial growth factor activity (anti‐VEGF agents) plus intravitreal steroids versus monotherapy with macular laser, intravitreal steroids or intravitreal anti‐VEGF agents for managing DMO.”
“There were eight RCTs (703 participants, 817 eyes) that met our inclusion criteria with only three studies reporting outcomes at one year. The studies took place in Iran (3), USA (2), Brazil (1), Czech Republic (1) and South Korea (1). […] When comparing anti‐VEGF/steroid with anti‐VEGF monotherapy as primary therapy for DMO, we found no meaningful clinical difference in change in BCVA [best corrected visual acuity] […] or change in CMT [central macular thickness] […] at one year. […] There was very low‐certainty evidence on intraocular inflammation from 8 studies, with one event in the anti‐VEGF/steroid group (313 eyes) and two events in the anti‐VEGF group (322 eyes). There was a greater risk of raised IOP (Peto odds ratio (OR) 8.13, 95% CI 4.67 to 14.16; 635 eyes; 8 RCTs; moderate‐certainty evidence) and development of cataract (Peto OR 7.49, 95% CI 2.87 to 19.60; 635 eyes; 8 RCTs; moderate‐certainty evidence) in eyes receiving anti‐VEGF/steroid compared with anti‐VEGF monotherapy. There was low‐certainty evidence from one study of an increased risk of systemic adverse events in the anti‐VEGF/steroid group compared with the anti‐VEGF alone group (Peto OR 1.32, 95% CI 0.61 to 2.86; 103 eyes).”
“One study compared anti‐VEGF/steroid versus macular laser therapy. At one year investigators did not report a meaningful difference between the groups in change in BCVA […] or change in CMT […]. There was very low‐certainty evidence suggesting an increased risk of cataract in the anti‐VEGF/steroid group compared with the macular laser group (Peto OR 4.58, 95% 0.99 to 21.10, 100 eyes) and an increased risk of elevated IOP in the anti‐VEGF/steroid group compared with the macular laser group (Peto OR 9.49, 95% CI 2.86 to 31.51; 100 eyes).”
“Authors’ conclusions
Combination of intravitreal anti‐VEGF plus intravitreal steroids does not appear to offer additional visual benefit compared with monotherapy for DMO; at present the evidence for this is of low‐certainty. There was an increased rate of cataract development and raised intraocular pressure in eyes treated with anti‐VEGF plus steroid versus anti‐VEGF alone. Patients were exposed to potential side effects of both these agents without reported additional benefit.”
…
vi. Association between diabetic foot ulcer and diabetic retinopathy.
“More than 25 million people in the United States are estimated to have diabetes mellitus (DM), and 15–25% will develop a diabetic foot ulcer (DFU) during their lifetime [1]. DFU is one of the most serious and disabling complications of DM, resulting in significantly elevated morbidity and mortality. Vascular insufficiency and associated neuropathy are important predisposing factors for DFU, and DFU is the most common cause of non-traumatic foot amputation worldwide. Up to 70% of all lower leg amputations are performed on patients with DM, and up to 85% of all amputations are preceded by a DFU [2, 3]. Every year, approximately 2–3% of all diabetic patients develop a foot ulcer, and many require prolonged hospitalization for the treatment of ensuing complications such as infection and gangrene [4, 5].
Meanwhile, a number of studies have noted that diabetic retinopathy (DR) is associated with diabetic neuropathy and microvascular complications [6–10]. Despite the magnitude of the impact of DFUs and their consequences, little research has been performed to investigate the characteristics of patients with a DFU and DR. […] the aim of this study was to investigate the prevalence of DR in patients with a DFU and to elucidate the potential association between DR and DFUs.”
“A retrospective review was conducted on DFU patients who underwent ophthalmic and vascular examinations within 6 months; 100 type 2 diabetic patients with DFU were included. The medical records of 2496 type 2 diabetic patients without DFU served as control data. DR prevalence and severity were assessed in DFU patients. DFU patients were compared with the control group regarding each clinical variable. Additionally, DFU patients were divided into two groups according to DR severity and compared. […] Out of 100 DFU patients, 90 patients (90%) had DR and 55 (55%) had proliferative DR (PDR). There was no significant association between DR and DFU severities (R = 0.034, p = 0.734). A multivariable analysis comparing type 2 diabetic patients with and without DFUs showed that the presence of DR [OR, 226.12; 95% confidence interval (CI), 58.07–880.49; p < 0.001] and proliferative DR [OR, 306.27; 95% CI, 64.35–1457.80; p < 0.001), higher HbA1c (%, OR, 1.97, 95% CI, 1.46–2.67; p < 0.001), higher serum creatinine (mg/dL, OR, 1.62, 95% CI, 1.06–2.50; p = 0.027), older age (years, OR, 1.12; 95% CI, 1.06–1.17; p < 0.001), higher pulse pressure (mmHg, OR, 1.03; 95% CI, 1.00–1.06; p = 0.025), lower cholesterol (mg/dL, OR, 0.94; 95% CI, 0.92–0.97; p < 0.001), lower BMI (kg/m2, OR, 0.87, 95% CI, 0.75–1.00; p = 0.044) and lower hematocrit (%, OR, 0.80, 95% CI, 0.74–0.87; p < 0.001) were associated with DFUs. In a subgroup analysis of DFU patients, the PDR group had a longer duration of diabetes mellitus, higher serum BUN, and higher serum creatinine than the non-PDR group. In the multivariable analysis, only higher serum creatinine was associated with PDR in DFU patients (OR, 1.37; 95% CI, 1.05–1.78; p = 0.021).
Conclusions
Diabetic retinopathy is prevalent in patients with DFU and about half of DFU patients had PDR. No significant association was found in terms of the severity of these two diabetic complications. To prevent blindness, patients with DFU, and especially those with high serum creatinine, should undergo retinal examinations for timely PDR diagnosis and management.”
Nephrology Board Review
…
Some links related to the lecture’s coverage:
Diabetic nephropathy.
Henoch–Schönlein purpura.
Leukocytoclastic Vasculitis.
Glomerulonephritis. Rapidly progressive glomerulonephritis.
Nephrosis.
Analgesic nephropathy.
Azotemia.
Allergic Interstitial Nephritis: Clinical Features and Pathogenesis.
Nonsteroidal anti-inflammatory drugs: effects on kidney function (Whelton & Hamilton, J Clin Pharmacol. 1991 Jul;31(7):588-98).
Goodpasture syndrome.
Creatinine. Limitations of serum creatinine as a marker of renal function.
Hyperkalemia.
U wave.
Nephrolithiasis. Calcium oxalate.
Calcium gluconate.
Bicarbonate.
Effect of various therapeutic approaches on plasma potassium and major regulating factors in terminal renal failure (Blumberg et al., 1988).
Effect of prolonged bicarbonate administration on plasma potassium in terminal renal failure (Blumberg et al., 1992).
Renal tubular acidosis.
Urine anion gap.
Metabolic acidosis.
Contrast-induced nephropathy.
Rhabdomyolysis.
Lipiduria. Urinary cast.
Membranous glomerulonephritis.
Postinfectious glomerulonephritis.
Circadian Rhythms (I)
“Circadian rhythms are found in nearly every living thing on earth. They help organisms time their daily and seasonal activities so that they are synchronized to the external world and the predictable changes in the environment. These biological clocks provide a cross-cutting theme in biology and they are incredibly important. They influence everything, from the way growing sunflowers track the sun from east to west, to the migration timing of monarch butterflies, to the morning peaks in cardiac arrest in humans. […] Years of work underlie most scientific discoveries. Explaining these discoveries in a way that can be understood is not always easy. We have tried to keep the general reader in mind but in places perseverance on the part of the reader may be required. In the end we were guided by one of our reviewers, who said: ‘If you want to understand calculus you have to show the equations.’”
…
The above quote is from the book‘s foreword. I really liked this book and I was close to giving it five stars on goodreads. Below I have added some observations and links related to the first few chapters of the book’s coverage (as noted in my review on goodreads the second half of the book is somewhat technical, and I’ve not yet decided if I’ll be blogging that part of the book in much detail, if at all).
…
“There have been over a trillion dawns and dusks since life began some 3.8 billion years ago. […] This predictable daily solar cycle results in regular and profound changes in environmental light, temperature, and food availability as day follows night. Almost all life on earth, including humans, employs an internal biological timer to anticipate these daily changes. The possession of some form of clock permits organisms to optimize physiology and behaviour in advance of the varied demands of the day/night cycle. Organisms effectively ‘know’ the time of day. Such internally generated daily rhythms are called ‘circadian rhythms’ […] Circadian rhythms are embedded within the genomes of just about every plant, animal, fungus, algae, and even cyanobacteria […] Organisms that use circadian rhythms to anticipate the rotation of the earth are thought to have a major advantage over both their competitors and predators. For example, it takes about 20–30 minutes for the eyes of fish living among coral reefs to switch vision from the night to daytime state. A fish whose eyes are prepared in advance for the coming dawn can exploit the new environment immediately. The alternative would be to wait for the visual system to adapt and miss out on valuable activity time, or emerge into a world where it would be more difficult to avoid predators or catch prey until the eyes have adapted. Efficient use of time to maximize survival almost certainly provides a large selective advantage, and consequently all organisms seem to be led by such anticipation. A circadian clock also stops everything happening within an organism at the same time, ensuring that biological processes occur in the appropriate sequence or ‘temporal framework’. For cells to function properly they need the right materials in the right place at the right time. Thousands of genes have to be switched on and off in order and in harmony. […] All of these processes, and many others, take energy and all have to be timed to best effect by the millisecond, second, minute, day, and time of year. Without this internal temporal compartmentalization and its synchronization to the external environment our biology would be in chaos. […] However, to be biologically useful, these rhythms must be synchronized or entrained to the external environment, predominantly by the patterns of light produced by the earth’s rotation, but also by other rhythmic changes within the environment such as temperature, food availability, rainfall, and even predation. These entraining signals, or time-givers, are known as zeitgebers. The key point is that circadian rhythms are not driven by an external cycle but are generated internally, and then entrained so that they are synchronized to the external cycle.”
“It is worth emphasizing that the concept of an internal clock, as developed by Richter and Bünning, has been enormously powerful in furthering our understanding of biological processes in general, providing a link between our physiological understanding of homeostatic mechanisms, which try to maintain a constant internal environment despite unpredictable fluctuations in the external environment […], versus the circadian system which enables organisms to anticipate periodic changes in the external environment. The circadian system provides a predictive 24-hour baseline in physiological parameters, which is then either defended or temporarily overridden by homeostatic mechanisms that accommodate an acute environmental challenge. […] Zeitgebers and the entrainment pathway synchronize the internal day to the astronomical day, usually via the light/dark cycle, and multiple output rhythms in physiology and behaviour allow appropriately timed activity. The multitude of clocks within a multicellular organism can all potentially tick with a different phase angle […], but usually they are synchronized to each other and by a central pacemaker which is in turn entrained to the external world via appropriate zeitgebers. […] Most biological reactions vary greatly with temperature and show a Q10 temperature coefficient of about 2 […]. This means that the biological process or reaction rate doubles as a consequence of increasing the temperature by 10°C up to a maximum temperature at which the biological reaction stops. […] a 10°C temperature increase doubles muscle performance. By contrast, circadian rhythms exhibit a Q10 close to 1 […] Clocks without temperature compensation are useless. […] Although we know that circadian clocks show temperature compensation, and that this phenomenon is a conserved feature across all circadian rhythms, we have little idea how this is achieved.”
“The systematic study of circadian rhythms only really started in the 1950s, and the pioneering studies of Colin Pittendrigh brought coherence to this emerging new discipline. […] From [a] mass of emerging data, Pittendrigh had key insights and defined the essential properties of circadian rhythms across all life. Namely that: all circadian rhythms are endogenous and show near 24-hour rhythms in a biological process (biochemistry, physiology, or behaviour); they persist under constant conditions for several cycles; they are entrained to the astronomical day via synchronizing zeitgebers; and they show temperature compensation such that the period of the oscillation does not alter appreciably with changes in environmental temperature. Much of the research since the 1950s has been the translation of these formalisms into biological structures and processes, addressing such questions as: What is the clock and where is it located within the intracellular processes of the cell? How can a set of biochemical reactions produce a regular self-sustaining rhythm that persists under constant conditions and has a period of about 24 hours? How is this internal oscillation synchronized by zeitgebers such as light to the astronomical day? Why is the clock not altered by temperature, speeding up when the environment gets hotter and slowing down in the cold? How is the information of the near 24-hour rhythm communicated to the rest of the organism?”
“There have been hundreds of studies showing that a broad range of activities, both physical and cognitive, vary across the 24-hour day: tooth pain is lowest in the morning; proofreading is best performed in the evening; labour pains usually begin at night and most natural births occur in the early morning hours. The accuracy of short and long badminton serves is higher in the afternoon than in the morning and evening. Accuracy of first serves in tennis is better in the morning and afternoon than in the evening, although speed is higher in the evening than in the morning. Swimming velocity over 50 metres is higher in the evening than in the morning and afternoon. […] The majority of studies report that performance increases from morning to afternoon or evening. […] Typical ‘optimal’ times of day for physical or cognitive activity are gathered routinely from population studies […]. However, there is considerable individual variation. Peak performance will depend upon age, chronotype, time zone, and for behavioural tasks how many hours the participant has been awake when conducting the task, and even the nature of the task itself. As a general rule, the circadian modulation of cognitive functioning results in an improved performance over the day for younger adults, while in older subjects it deteriorates. […] On average the circadian rhythms of an individual in their late teens will be delayed by around two hours compared with an individual in their fifties. As a result the average teenager experiences considerable social jet lag, and asking a teenager to get up at 07.00 in the morning is the equivalent of asking a 50-year-old to get up at 05.00 in the morning.”
“Day versus night variations in blood pressure and heart rate are among the best-known circadian rhythms of physiology. In humans, there is a 24-hour variation in blood pressure with a sharp rise before awakening […]. Many cardiovascular events, such as sudden cardiac death, myocardial infarction, and stroke, display diurnal variations with an increased incidence between 06.00 and 12.00 in the morning. Both atrial and ventricular arrhythmias appear to exhibit circadian patterning as well, with a higher frequency during the day than at night. […] Myocardial infarction (MI) is two to three times more frequent in the morning than at night. In the early morning, the increased systolic blood pressure and heart rate results in an increased energy and oxygen demand by the heart, while the vascular tone of the coronary artery rises in the morning, resulting in a decreased coronary blood flow and oxygen supply. This mismatch between supply and demand underpins the high frequency of onset of MI. Plaque blockages are more likely to occur in the morning as platelet surface activation markers have a circadian pattern producing a peak of thrombus formation and platelet aggregation. The resulting hypercoagulability partially underlies the morning onset of MI.”
“A critical area where time of day matters to the individual is the optimum time to take medication, a branch of medicine that has been termed ‘chronotherapy’. Statins are a family of cholesterol-lowering drugs which inhibit HMGCR-reductase […] HMGCR is under circadian control and is highest at night. Hence those statins with a short half-life, such as simvastatin and lovastatin, are most effective when taken before bedtime. In another clinical domain entirely, recent studies have shown that anti-flu vaccinations given in the morning provoke a stronger immune response than those given in the afternoon. The idea of using chronotherapy to improve the efficacy of anti-cancer drugs has been around for the best part of 30 years. […] In experimental models more than thirty anti-cancer drugs have been found to vary in toxicity and efficacy by as much as 50 per cent as a function of time of administration. Although Lévi and others have shown the advantages to treating individual patients by different timing regimes, few hospitals have taken it up. One reason is that the best time to apply many of these treatments is late in the day or during the night, precisely when most hospitals lack the infrastructure and personnel to deliver such treatments.”
“Flying across multiple time zones and shift work has significant economic benefits, but the costs in terms of ill health are only now becoming clear. Sleep and circadian rhythm disruption (SCRD) is almost always associated with poor health. […] The impact of jet lag has long been known by elite athletes […] even when superbly fit individuals fly across time zones there is a very prolonged disturbance of circadian-driven rhythmic physiology. […] Horses also suffer from jet lag. […] Even bees can get jet lag. […] The misalignments that occur as a result of the occasional transmeridian flight are transient. Shift working represents a chronic misalignment. […] Nurses are one of the best-studied groups of night shift workers. Years of shift work in these individuals has been associated with a broad range of health problems including type II diabetes, gastrointestinal disorders, and even breast and colorectal cancers. Cancer risk increases with the number of years of shift work, the frequency of rotating work schedules, and the number of hours per week working at night [For people who are interested to know more about this, I previously covered a text devoted exclusively to these topics here and here.]. The correlations are so strong that shift work is now officially classified as ‘probably carcinogenic [Group 2A]’ by the World Health Organization. […] the partners and families of night shift workers need to be aware that mood swings, loss of empathy, and irritability are common features of working at night.”
“There are some seventy sleep disorders recognized by the medical community, of which four have been labelled as ‘circadian rhythm sleep disorders’ […] (1) Advanced sleep phase disorder (ASPD) […] is characterized by difficulty staying awake in the evening and difficulty staying asleep in the morning. Typically individuals go to bed and rise about three or more hours earlier than the societal norm. […] (2) Delayed sleep phase disorder (DSPD) is a far more frequent condition and is characterized by a 3-hour delay or more in sleep onset and offset and is a sleep pattern often found in some adolescents and young adults. […] ASPD and DSPD can be considered as pathological extremes of morning or evening preferences […] (3) Freerunning or non-24-hour sleep/wake rhythms occur in blind individuals who have either had their eyes completely removed or who have no neural connection from the retina to the brain. These people are not only visually blind but are also circadian blind. Because they have no means of detecting the synchronizing light signals they cannot reset their circadian rhythms, which freerun with a period of about 24 hours and 10 minutes. So, after six days, internal time is on average 1 hour behind environmental time. (4) Irregular sleep timing has been observed in individuals who lack a circadian clock as a result of a tumour in their anterior hypothalamus […]. Irregular sleep timing is [also] commonly found in older people suffering from dementia. It is an extremely important condition because one of the major factors in caring for those with dementia is the exhaustion of the carers which is often a consequence of the poor sleep patterns of those for whom they are caring. Various protocols have been attempted in nursing homes using increased light in the day areas and darkness in the bedrooms to try and consolidate sleep. Such approaches have been very successful in some individuals […] Although insomnia is the commonly used term to describe sleep disruption, technically insomnia is not a ‘circadian rhythm sleep disorder’ but rather a general term used to describe irregular or disrupted sleep. […] Insomnia is described as a ‘psychophysiological’ condition, in which mental and behavioural factors play predisposing, precipitating, and perpetuating roles. The factors include anxiety about sleep, maladaptive sleep habits, and the possibility of an underlying vulnerability in the sleep-regulating mechanism. […] Even normal ‘healthy ageing’ is associated with both circadian rhythm sleep disorders and insomnia. Both the generation and regulation of circadian rhythms have been shown to become less robust with age, with blunted amplitudes and abnormal phasing of key physiological processes such as core body temperature, metabolic processes, and hormone release. Part of the explanation may relate to a reduced light signal to the clock […]. In the elderly, the photoreceptors of the eye are often exposed to less light because of the development of cataracts and other age-related eye disease. Both these factors have been correlated with increased SCRD.”
“Circadian rhythm research has mushroomed in the past twenty years, and has provided a much greater understanding of the impact of both imposed and illness-related SCRD. We now appreciate that our increasingly 24/7 society and social disregard for biological time is having a major impact upon our health. Understanding has also been gained about the relationship between SCRD and a spectrum of different illnesses. SCRD in illness is not simply the inconvenience of being unable to sleep at an appropriate time but is an agent that exacerbates or causes serious health problems.”
…
Links:
Circadian rhythm.
Acrophase.
Phase (waves). Phase angle.
Jean-Jacques d’Ortous de Mairan.
Heliotropism.
Kymograph.
John Harrison.
Munich Chronotype Questionnaire.
Chronotype.
Seasonal affective disorder. Light therapy.
Parkinson’s disease. Multiple sclerosis.
Melatonin.
Developmental Biology (II)
Below I have included some quotes from the middle chapters of the book and some links related to the topic coverage. As I already pointed out earlier, this is an excellent book on these topics.
…
“Germ cells have three key functions: the preservation of the genetic integrity of the germline; the generation of genetic diversity; and the transmission of genetic information to the next generation. In all but the simplest animals, the cells of the germline are the only cells that can give rise to a new organism. So, unlike body cells, which eventually all die, germ cells in a sense outlive the bodies that produced them. They are, therefore, very special cells […] In order that the number of chromosomes is kept constant from generation to generation, germ cells are produced by a specialized type of cell division, called meiosis, which halves the chromosome number. Unless this reduction by meiosis occurred, the number of chromosomes would double each time the egg was fertilized. Germ cells thus contain a single copy of each chromosome and are called haploid, whereas germ-cell precursor cells and the other somatic cells of the body contain two copies and are called diploid. The halving of chromosome number at meiosis means that when egg and sperm come together at fertilization, the diploid number of chromosomes is restored. […] An important property of germ cells is that they remain pluripotent—able to give rise to all the different types of cells in the body. Nevertheless, eggs and sperm in mammals have certain genes differentially switched off during germ-cell development by a process known as genomic imprinting […] Certain genes in eggs and sperm are imprinted, so that the activity of the same gene is different depending on whether it is of maternal or paternal origin. Improper imprinting can lead to developmental abnormalities in humans. At least 80 imprinted genes have been identified in mammals, and some are involved in growth control. […] A number of developmental disorders in humans are associated with imprinted genes. Infants with Prader-Willi syndrome fail to thrive and later can become extremely obese; they also show mental retardation and mental disturbances […] Angelman syndrome results in severe motor and mental retardation. Beckwith-Wiedemann syndrome is due to a generalized disruption of imprinting on a region of chromosome 7 and leads to excessive foetal overgrowth and an increased predisposition to cancer.”
“Sperm are motile cells, typically designed for activating the egg and delivering their nucleus into the egg cytoplasm. They essentially consist of a nucleus, mitochondria to provide an energy source, and a flagellum for movement. The sperm contributes virtually nothing to the organism other than its chromosomes. In mammals, sperm mitochondria are destroyed following fertilization, and so all mitochondria in the animal are of maternal origin. […] Different organisms have different ways of ensuring fertilization by only one sperm. […] Early development is similar in both male and female mammalian embryos, with sexual differences only appearing at later stages. The development of the individual as either male or female is genetically fixed at fertilization by the chromosomal content of the egg and sperm that fuse to form the fertilized egg. […] Each sperm carries either an X or Y chromosome, while the egg has an X. The genetic sex of a mammal is thus established at the moment of conception, when the sperm introduces either an X or a Y chromosome into the egg. […] In the absence of a Y chromosome, the default development of tissues is along the female pathway. […] Unlike animals, plants do not set aside germ cells in the embryo and germ cells are only specified when a flower develops. Any meristem cell can, in principle, give rise to a germ cell of either sex, and there are no sex chromosomes. The great majority of flowering plants give rise to flowers that contain both male and female sexual organs, in which meiosis occurs. The male sexual organs are the stamens; these produce pollen, which contains the male gamete nuclei corresponding to the sperm of animals. At the centre of the flower are the female sex organs, which consist of an ovary of two carpels, which contain the ovules. Each ovule contains an egg cell.”
“The character of specialized cells such as nerve, muscle, or skin is the result of a particular pattern of gene activity that determines which proteins are synthesized. There are more than 200 clearly recognizable differentiated cell types in mammals. How these particular patterns of gene activity develop is a central question in cell differentiation. Gene expression is under a complex set of controls that include the actions of transcription factors, and chemical modification of DNA. External signals play a key role in differentiation by triggering intracellular signalling pathways that affect gene expression. […] the central feature of cell differentiation is a change in gene expression, which brings about a change in the proteins in the cells. The genes expressed in a differentiated cell include not only those for a wide range of ‘housekeeping’ proteins, such as the enzymes involved in energy metabolism, but also genes encoding cell-specific proteins that characterize a fully differentiated cell: hemoglobin in red blood cells, keratin in skin epidermal cells, and muscle-specific actin and myosin protein filaments in muscle. […] several thousand different genes are active in any given cell in the embryo at any one time, though only a small number of these may be involved in specifying cell fate or differentiation. […] Cell differentiation is known to be controlled by a wide range of external signals but it is important to remember that, while these external signals are often referred to as being ‘instructive’, they are ‘selective’, in the sense that the number of developmental options open to a cell at any given time is limited. These options are set by the cell’s internal state which, in turn, reflects its developmental history. External signals cannot, for example, convert an endodermal cell into a muscle or nerve cell. Most of the molecules that act as developmentally important signals between cells during development are proteins or peptides, and their effect is usually to induce a change in gene expression. […] The same external signals can be used again and again with different effects because the cells’ histories are different. […] At least 1,000 different transcription factors are encoded in the genomes of the fly and the nematode, and as many as 3,000 in the human genome. On average, around five different transcription factors act together at a control region […] In general, it can be assumed that activation of each gene involves a unique combination of transcription factors.”
“Stem cells involve some special features in relation to differentiation. A single stem cell can divide to produce two daughter cells, one of which remains a stem cell while the other gives rise to a lineage of differentiating cells. This occurs in our skin and gut all the time and also in the production of blood cells. It also occurs in the embryo. […] Embryonic stem (ES) cells from the inner cell mass of the early mammalian embryo when the primitive streak forms, can, in culture, differentiate into a wide variety of cell types, and have potential uses in regenerative medicine. […] it is now possible to make adult body cells into stem cells, which has important implications for regenerative medicine. […] The goal of regenerative medicine is to restore the structure and function of damaged or diseased tissues. As stem cells can proliferate and differentiate into a wide range of cell types, they are strong candidates for use in cell-replacement therapy, the restoration of tissue function by the introduction of new healthy cells. […] The generation of insulin-producing pancreatic β cells from ES cells to replace those destroyed in type 1 diabetes is a prime medical target. Treatments that direct the differentiation of ES cells towards making endoderm derivatives such as pancreatic cells have been particularly difficult to find. […] The neurodegenerative Parkinson disease is another medical target. […] To generate […] stem cells of the patient’s own tissue type would be a great advantage, and the recent development of induced pluripotent stem cells (iPS cells) offers […] exciting new opportunities. […] There is [however] risk of tumour induction in patients undergoing cell-replacement therapy with ES cells or iPS cells; undifferentiated pluripotent cells introduced into the patient could cause tumours. Only stringent selection procedures that ensure no undifferentiated cells are present in the transplanted cell population will overcome this problem. And it is not yet clear how stable differentiated ES cells and iPS cells will be in the long term.”
“In general, the success rate of cloning by body-cell nuclear transfer in mammals is low, and the reasons for this are not yet well understood. […] Most cloned mammals derived from nuclear transplantation are usually abnormal in some way. The cause of failure is incomplete reprogramming of the donor nucleus to remove all the earlier modifications. A related cause of abnormality may be that the reprogrammed genes have not gone through the normal imprinting process that occurs during germ-cell development, where different genes are silenced in the male and female parents. The abnormalities in adults that do develop from cloned embryos include early death, limb deformities and hypertension in cattle, and immune impairment in mice. All these defects are thought to be due to abnormalities of gene expression that arise from the cloning process. Studies have shown that some 5% of the genes in cloned mice are not correctly expressed and that almost half of the imprinted genes are incorrectly expressed.”
“Organ development involves large numbers of genes and, because of this complexity, general principles can be quite difficult to distinguish. Nevertheless, many of the mechanisms used in organogenesis are similar to those of earlier development, and certain signals are used again and again. Pattern formation in development in a variety of organs can be specified by position information, which is specified by a gradient in some property. […] Not surprisingly, the vascular system, including blood vessels and blood cells, is among the first organ systems to develop in vertebrate embryos, so that oxygen and nutrients can be delivered to the rapidly developing tissues. The defining cell type of the vascular system is the endothelial cell, which forms the lining of the entire circulatory system, including the heart, veins, and arteries. Blood vessels are formed by endothelial cells and these vessels are then covered by connective tissue and smooth muscle cells. Arteries and veins are defined by the direction of blood flow as well as by structural and functional differences; the cells are specified as arterial or venous before they form blood vessels but they can switch identity. […] Differentiation of the vascular cells requires the growth factor VEGF (vascular endothelial growth factor) and its receptors, and VEGF stimulates their proliferation. Expression of the Vegf gene is induced by lack of oxygen and thus an active organ using up oxygen promotes its own vascularization. New blood capillaries are formed by sprouting from pre-existing blood vessels and proliferation of cells at the tip of the sprout. […] During their development, blood vessels navigate along specific paths towards their targets […]. Many solid tumours produce VEGF and other growth factors that stimulate vascular development and so promote the tumour’s growth, and blocking new vessel formation is thus a means of reducing tumour growth. […] In humans, about 1 in 100 live-born infants has some congenital heart malformation, while in utero, heart malformation leading to death of the embryo occurs in between 5 and 10% of conceptions.”
“Separation of the digits […] is due to the programmed cell death of the cells between these digits’ cartilaginous elements. The webbed feet of ducks and other waterfowl are simply the result of less cell death between the digits. […] the death of cells between the digits is essential for separating the digits. The development of the vertebrate nervous system also involves the death of large numbers of neurons.”
…
Links:
Budding.
Gonad.
Down Syndrome.
Fertilization. In vitro fertilisation. Preimplantation genetic diagnosis.
SRY gene.
X-inactivation. Dosage compensation.
Cellular differentiation.
MyoD.
Signal transduction. Enhancer (genetics).
Epigenetics.
Hematopoiesis. Hematopoietic stem cell transplantation. Hemoglobin. Sickle cell anemia.
Skin. Dermis. Fibroblast. Epidermis.
Skeletal muscle. Myogenesis. Myoblast.
Cloning. Dolly.
Organogenesis.
Limb development. Limb bud. Progress zone model. Apical ectodermal ridge. Polarizing region/Zone of polarizing activity. Sonic hedgehog.
Imaginal disc. Pax6. Aniridia. Neural tube.
Branching morphogenesis.
Pistil.
ABC model of flower development.
100 Cases in Orthopaedics and Rheumatology (II)
Below I have added some links related to the last half of the book’s coverage, as well as some more observations from the book.
…
Scaphoid fracture. Watson’s test. Dorsal intercalated segment instability. (“Non-union is not uncommon as a complication after scaphoid fractures because the blood supply to this bone is poor. Smokers have a higher incidence of non-union. Occasionally, the blood supply is poor enough to lead to avascular necrosis. If non-union is not detected, subsequent arthritis in the wrist can develop.”)
Septic arthritis. (“Septic arthritis is an orthopaedic emergency. […] People with septic arthritis are typically unwell with fevers and malaise and the joint pain is severe. […] Any acutely hot or painful joint is septic arthritis until proven otherwise.”)
Rheumatoid arthritis. (“[RA is] the most common of the inflammatory arthropathies. […] early-morning stiffness and pain, combined with soft-tissue rather than bony swelling, are classic patterns for inflammatory disease. Although […] RA affects principally the small joints of the hands (and feet), it may progress to involve any synovial joint and may be complicated by extra-articular features […] family history [of the disease] is not unusual due to the presence of susceptibility genes such as HLA-DR. […] Not all patients with RA have rheumatoid factor (RF), and not all patients with RF have RA; ACPA has greater specificity for RA than rheumatoid factor. […] Medical therapy focuses on disease-modifying anti-rheumatic drugs (DMARDs) such as methotrexate, sulphasalazine, leflunomide and hydroxychloroquine which may be used individually or in combination. […] Disease activity in RA is measured by the disease activity score (DAS), which is a composite score of the clinical evidence of synovitis, the current inflammatory response and the patient’s own assessment of their health. […] Patients who have high disease activity as determined by the DAS and have either failed or failed to tolerate standard disease modifying therapy qualify for biologic therapy – monoclonal antibodies that are directed against key components of the inflammatory response. […] TNF-α blockade is highly effective in up to 70 per cent of patients, reducing both inflammation and the progressive structural damage associated with severe active disease.”)
Ankylosing spondylitis. Ankylosis. Schober’s index. Costochondritis.
Mononeuritis multiplex. (“Mononeuritis multiplex arises due to interruption of the vasa nervorum, the blood supply to peripheral nerves […] Mononeuritis multiplex is commonly caused by diabetes or vasculitis. […] Vasculitis – inflammation of blood vessels and subsequent obstruction to blood flow – can be primary (idiopathic) or secondary, in which case it is associated with an underlying condition such as rheumatoid arthritis. The vasculitides are classified according to the size of the vessel involved. […] Management of mononeuritis multiplex is based on potent immunosuppression […] and the treatment of underlying infections such as hepatitis.”)
Multiple myeloma. Bence-Jones protein. (“The combination of bone pain and elevated ESR and calcium is suggestive of multiple myeloma.”)
Osteoporosis. DEXA scan. T-score. (“Postmenopausal bone loss is the most common cause of osteoporosis, but secondary osteoporosis may occur in the context of a number of medical conditions […] Steroid-induced osteoporosis is a significant problem in medical practice. […] All patients receiving corticosteroids should have bone protection […] Pharmacological treatment in the form of calcium supplementation and biphosphonates to reduce osteoclast activity is effective but compliance is typically poor.”)
Osteomalacia. Rickets. Craniotabes.
Paget’s disease (see also this post). (“In practical terms, the main indication to treat Paget’s disease is pain […] although bone deformity or compression syndromes (or risk thereof) would also prompt therapy. The treatment of choice is a biphosphonate to diminish osteoclast activity”).
Stress fracture. Female athlete triad. (“Stress fractures are overuse injuries and occur when periosteal resorption exceeds bone formation. They are commonly seen in two main patient groups: soldiers may suffer so-called march fractures in the metatarsals, while athletes may develop them in different sites according to their sporting activity. Although the knee is a common site in runners due to excess mechanical loading, stress fractures may also result in non-weight-bearing sites due to repetitive and excessive traction […]. The classic symptom […] is of pain that occurs throughout running and crucially persists with rest; this is in contrast to shin splints, a traction injury to the tibial periosteum in which the pain diminishes somewhat with continued activity […] The crucial feature of rehabilitation is a graded return to sport to prevent progression or recurrence.”)
Psoriatic arthritis. (“Arthropathy and rash is a common combination in rheumatology […] Psoriatic arthritis is a common inflammatory arthropathy that affects up to 15 per cent of those with psoriasis. […] Nail disease is very helpful in differentiating psoriatic arthritis from other forms of inflammatory arthropathy.”)
Ehlers–Danlos syndromes. Marfan syndrome. Beighton (hypermobility) score.
Carpal tunnel syndrome. (“Carpal tunnel syndrome is the most common entrapment neuropathy […] The classic symptoms are of tingling in the sensory distribution of the median nerve (i.e. the lateral three and a half digits); loss of thumb abduction is a late feature. Symptoms are often worse at night (when the hand might be quite painful) and in certain postures […] The majority of cases are idiopathic, but pregnancy and rheumatoid arthritis are very common precipitating causes […] The majority of patients will respond well to conservative management […] If these measures fail, corticosteroid injection into the carpal tunnel can be very effective in up to 80 per cent of patients. Surgical decompression should be reserved for those with persistent disabling symptoms or motor loss.”)
Mixed connective tissue disease.
Crystal arthropathy. Tophus. Uric acid nephropathy. Chondrocalcinosis. (“In any patient presenting with an acutely painful and swollen joint, the most important diagnoses to consider are septic arthritis and crystal arthropathy. Crystal arthropathy such as gout is more common than septic arthritis […] Gout may be precipitated by diuretics, renal impairment and aspirin use”).
Familial Mediterranean fever. Amyloidosis.
Systemic lupus erythematosus (see also this). Jaccoud arthropathy. Lupus nephritis. (“Renal disease is the most feared complication of SLE.”)
Scleroderma. Raynaud’s phenomenon. (“Scleroderma is an uncommon disorder characterized by thickening of the skin and, to a greater or lesser degree, fibrosis of internal organs.”)
Henoch-Schönlein purpura. Cryoglobulinemia. (“Purpura are the result of a spontaneous extravasation of blood from the capillaries into the skin. If small they are known as petechiae, when they are large they are termed ecchymoses. There is an extensive differential diagnosis for purpura […] The combination of palpable purpura (distributed particularly over the buttocks and extensor surfaces of legs), abdominal pain, arthritis and renal disease is a classic presentation of Henoch–Schönlein purpura (HSP). HSP is a distinct and frequently self-limiting small-vessel vasculitis that can affect any age; but the majority of cases present in children aged 2–10 years, in whom the prognosis is more benign than the adult form, often remitting entirely within 3–4 months. The abdominal pain may mimic a surgical abdomen and can presage intussusception, haemorrhage or perforation. The arthritis, in contrast, is relatively mild and tends to affect the knees and ankles.”)
Rheumatic fever.
Erythema nodosum. (“Mild idiopathic erythema nodosum […] needs no specific treatment”).
Rheumatoid lung disease. Bronchiolitis obliterans. Methotrexate-induced pneumonitis. Hamman–Rich syndrome.
Antiphospholipid syndrome. Sapporo criteria. (“Antiphospholipid syndrome is a hypercoagulable state characterized by recurrent arteriovenous thrombosis and/or pregnancy morbidity in the presence of either a lupus anticoagulant or anticardiolipin antibody (both phospholipid-related proteins). […] The most common arteriovenous thrombotic events in antiphospholipid syndrome are deep venous thrombosis and pulmonary embolus […], but any part of the circulation may be involved, with arterial events such as myocardial infarction and stroke carrying a high mortality rate. Poor placental circulation is thought to be responsible for the high pregnancy morbidity, with recurrent first- and second-trimester loss and a higher rate of pre-eclampsia being typical clinical features.”)
Still’s disease. (“Consider inflammatory disease in cases of pyrexia of unknown origin.”)
Polymyalgia rheumatica. Giant cell arteritis. (“[P]olymyalgia rheumatica (PMR) [is] a systemic inflammatory syndrome affecting the elderly that is characterized by bilateral pain and stiffness in the shoulders and hip girdles. The stiffness can be profound and limits mobility although true muscle weakness is not a feature. […] The affected areas are diffusely tender, with movements limited by pain. […] care must be taken not to attribute joint inflammation to PMR until other diagnoses have been excluded; for example, a significant minority of RA patients may present with a polymyalgic onset. […] The treatment for PMR is low-dose corticosteroids. […] Many physicians would consider a dramatic response to low-dose prednisolone as almost diagnostic for PMR, so if a patients symptoms do not improve rapidly it is wise to re-evaluate the original diagnosis.”)
Relapsing polychondritis. (“Relapsing polychondritis is characterized histologically by inflammatory infiltration and later fibrosis of cartilage. Any cartilage, in any location, is at risk. […] Treatment of relapsing polychondritis is with corticosteroids […] Surgical reconstruction of collapsed structures is not an option as the deformity tends to continue postoperatively.”)
Dermatomyositis. Gottron’s Papules.
Enteropathic arthritis. (“A seronegative arthritis may develop in up to 15 per cent of patients with any form of inflammatory bowel disease, including ulcerative colitis (UC), Crohn’s disease or microscopic and collagenous colitis. The most common clinical presentations are a peripheral arthritis […] and spondyloarthritis.”)
Reflex sympathetic dystrophy.
Whipple’s disease. (“Although rare, consider Whipple’s disease in any patient presenting with malabsorption, weight loss and arthritis.”)
Wegener’s granulomatosis. (“Small-vessel vasculitis may cause a pulmonary-renal syndrome. […] The classic triad of Weneger’s granulomatosis is the presence of upper and lower respiratory tract disease and renal impairment.”)
Reactive arthritis. Reiter’s syndrome. (“Consider reactive arthritis in any patient presenting with a monoarthropathy. […] Reactive arthritis is generally benign, with up to 80 per cent making a full recovery.”)
Sarcoidosis. Löfgren syndrome.
Polyarteritis nodosa. (“Consider mesenteric ischaemia in any patient presenting with a systemic illness and postprandial abdominal pain.”)
Sjögren syndrome. Schirmer’s test.
Behçet syndrome.
Lyme disease. Erythema chronicum migrans. (“The combination of rash leading to arthralgia and cranial neuropathy is a classic presentation of Lyme disease.”)
Takayasu arteritis. (“Takayasu’s arteritis is an occlusive vasculitis leading to stenoses of the aorta and its principal branches. The symptoms and signs of the disease depend on the distribution of the affected vessel but upper limbs are generally affected more commonly than the iliac tributaries. […] the disease is a chronic relapsing and remitting condition […] The mainstay of treatment is high-dose corticosteroids plus a steroid-sparing agent such as methotrexate. […] Cyclophosphamide is reserved for those patients who do not achieve remission with standard therapy. Surgical intervention such as bypass or angioplasty may improve ischaemic symptoms once the inflammation is under control.”)
Lymphoma.
Haemarthrosis. (“Consider synovial tumours in a patient with unexplained haemarthrosis.”)
Juvenile idiopathic arthritis.
Drug-induced lupus erythematosus. (“Drug-induced lupus (DIL) generates a different spectrum of clinical manifestations from idiopathic disease. DIL is less severe than idiopathic SLE, and nephritis or central nervous system involvement is very rare. […] The most common drugs responsible for a lupus-like syndrome are procainamide, hydralazine, quinidine, isoniazid, methyldopa, chlorpromazine and minocycline. […] Treatment involves stopping the offending medication and the symptoms will gradually resolve.”)
Churg–Strauss syndrome.
A few diabetes papers of interest
i. Clinical Inertia in Type 2 Diabetes Management: Evidence From a Large, Real-World Data Set.
“Despite clinical practice guidelines that recommend frequent monitoring of HbA1c (every 3 months) and aggressive escalation of antihyperglycemic therapies until glycemic targets are reached (1,2), the intensification of therapy in patients with uncontrolled type 2 diabetes (T2D) is often inappropriately delayed. The failure of clinicians to intensify therapy when clinically indicated has been termed “clinical inertia.” A recently published systematic review found that the median time to treatment intensification after an HbA1c measurement above target was longer than 1 year (range 0.3 to >7.2 years) (3). We have previously reported a rather high rate of clinical inertia in patients uncontrolled on metformin monotherapy (4). Treatment was not intensified early (within 6 months of metformin monotherapy failure) in 38%, 31%, and 28% of patients when poor glycemic control was defined as an HbA1c >7% (>53 mmol/mol), >7.5% (>58 mmol/mol), and >8% (>64 mmol/mol), respectively.
Using the electronic health record system at Cleveland Clinic (2005–2016), we identified a cohort of 7,389 patients with T2D who had an HbA1c value ≥7% (≥53 mmol/mol) (“index HbA1c”) despite having been on a stable regimen of two oral antihyperglycemic drugs (OADs) for at least 6 months prior to the index HbA1c. This HbA1c threshold would generally be expected to trigger treatment intensification based on current guidelines. Patient records were reviewed for the 6-month period following the index HbA1c, and changes in diabetes therapy were evaluated for evidence of “intensification” […] almost two-thirds of patients had no evidence of intensification in their antihyperglycemic therapy during the 6 months following the index HbA1c ≥7% (≥53 mmol/mol), suggestive of poor glycemic control. Most alarming was the finding that even among patients in the highest index HbA1c category (≥9% [≥75 mmol/mol]), therapy was not intensified in 44% of patients, and slightly more than half (53%) of those with an HbA1c between 8 and 8.9% (64 and 74 mmol/mol) did not have their therapy intensified.”
“Unfortunately, these real-world findings confirm a high prevalence of clinical inertia with regard to T2D management. The unavoidable conclusion from these data […] is that physicians are not responding quickly enough to evidence of poor glycemic control in a high percentage of patients, even in those with HbA1c levels far exceeding typical treatment targets.”
…
“Medical nutrition therapy is a mainstay of gestational diabetes mellitus (GDM) treatment. However, data are limited regarding the optimal diet for achieving euglycemia and improved perinatal outcomes. This study aims to investigate whether modified dietary interventions are associated with improved glycemia and/or improved birth weight outcomes in women with GDM when compared with control dietary interventions. […]
From 2,269 records screened, 18 randomized controlled trials involving 1,151 women were included. Pooled analysis demonstrated that for modified dietary interventions when compared with control subjects, there was a larger decrease in fasting and postprandial glucose (−4.07 mg/dL [95% CI −7.58, −0.57]; P = 0.02 and −7.78 mg/dL [95% CI −12.27, −3.29]; P = 0.0007, respectively) and a lower need for medication treatment (relative risk 0.65 [95% CI 0.47, 0.88]; P = 0.006). For neonatal outcomes, analysis of 16 randomized controlled trials including 841 participants showed that modified dietary interventions were associated with lower infant birth weight (−170.62 g [95% CI −333.64, −7.60]; P = 0.04) and less macrosomia (relative risk 0.49 [95% CI 0.27, 0.88]; P = 0.02). The quality of evidence for these outcomes was low to very low. Baseline differences between groups in postprandial glucose may have influenced glucose-related outcomes. […] we were unable to resolve queries regarding potential concerns for sources of bias because of lack of author response to our queries. We have addressed this by excluding these studies in the sensitivity analysis. […] after removal of the studies with the most substantial methodological concerns in the sensitivity analysis, differences in the change in fasting plasma glucose were no longer significant. Although differences in the change in postprandial glucose and birth weight persisted, they were attenuated.”
“This review highlights limitations of the current literature examining dietary interventions in GDM. Most studies are too small to demonstrate significant differences in our primary outcomes. Seven studies had fewer than 50 participants and only two had more than 100 participants (n = 125 and 150). The short duration of many dietary interventions and the late gestational age at which they were started (38) may also have limited their impact on glycemic and birth weight outcomes. Furthermore, we cannot conclude if the improvements in maternal glycemia and infant birth weight are due to reduced energy intake, improved nutrient quality, or specific changes in types of carbohydrate and/or protein. […] These data suggest that dietary interventions modified above and beyond usual dietary advice for GDM have the potential to offer better maternal glycemic control and infant birth weight outcomes. However, the quality of evidence was judged as low to very low due to the limitations in the design of included studies, the inconsistency between their results, and the imprecision in their effect estimates.”
…
iii. Lifetime Prevalence and Prognosis of Prediabetes Without Progression to Diabetes.
“Impaired fasting glucose, also termed prediabetes, is increasingly prevalent and is associated with adverse cardiovascular risk (1). The cardiovascular risks attributed to prediabetes may be driven primarily by the conversion from prediabetes to overt diabetes (2). Given limited data on outcomes among nonconverters in the community, the extent to which some individuals with prediabetes never go on to develop diabetes and yet still experience adverse cardiovascular risk remains unclear. We therefore investigated the frequency of cardiovascular versus noncardiovascular deaths in people who developed early- and late-onset prediabetes without ever progressing to diabetes.”
“We used data from the Framingham Heart Study collected on the Offspring Cohort participants aged 18–77 years at the time of initial fasting plasma glucose (FPG) assessment (1983–1987) who had serial FPG testing over subsequent examinations with continuous surveillance for outcomes including cause-specific mortality (3). As applied in prior epidemiological investigations (4), we used a case-control design focusing on the cause-specific outcome of cardiovascular death to minimize the competing risk issues that would be encountered in time-to-event analyses. To focus on outcomes associated with a given chronic glycemic state maintained over the entire lifetime, we restricted our analyses to only those participants for whom data were available over the life course and until death. […] We excluded individuals with unknown age of onset of glycemic impairment (i.e., age ≥50 years with prediabetes or diabetes at enrollment). […] We analyzed cause-specific mortality, allowing for relating time-varying exposures with lifetime risk for an event (4). We related glycemic phenotypes to cardiovascular versus noncardiovascular cause of death using a case-control design, where cases were defined as individuals who died of cardiovascular disease (death from stroke, heart failure, or other vascular event) or coronary heart disease (CHD) and controls were those who died of other causes.”
“The mean age of participants at enrollment was 42 ± 7 years (43% women). The mean age at death was 73 ± 10 years. […] In our study, approximately half of the individuals presented with glycemic impairment in their lifetime, of whom two-thirds developed prediabetes but never diabetes. In our study, these individuals had lower cardiovascular-related mortality compared with those who later developed diabetes, even if the prediabetes onset was early in life. However, individuals with early-onset prediabetes, despite lifelong avoidance of overt diabetes, had greater propensity for death due to cardiovascular or coronary versus noncardiovascular disease compared with those who maintained lifelong normal glucose status. […] Prediabetes is a heterogeneous entity. Whereas some forms of prediabetes are precursors to diabetes, other types of prediabetes never progress to diabetes but still confer increased propensity for death from a cardiovascular cause.”
…
iv. Learning From Past Failures of Oral Insulin Trials.
“Very recently one of the largest type 1 diabetes prevention trials using daily administration of oral insulin or placebo was completed. After 9 years of study enrollment and follow-up, the randomized controlled trial failed to delay the onset of clinical type 1 diabetes, which was the primary end point. The unfortunate outcome follows the previous large-scale trial, the Diabetes Prevention Trial–Type 1 (DPT-1), which again failed to delay diabetes onset with oral insulin or low-dose subcutaneous insulin injections in a randomized controlled trial with relatives at risk for type 1 diabetes. These sobering results raise the important question, “Where does the type 1 diabetes prevention field move next?” In this Perspective, we advocate for a paradigm shift in which smaller mechanistic trials are conducted to define immune mechanisms and potentially identify treatment responders. […] Mechanistic trials will allow for better trial design and patient selection based upon molecular markers prior to large randomized controlled trials, moving toward a personalized medicine approach for the prevention of type 1 diabetes.”
“Before a disease can be prevented, it must be predicted. The ability to assess risk for developing type 1 diabetes (T1D) has been well documented over the last two decades (1). Using genetic markers, human leukocyte antigen (HLA) DQ and DR typing (2), islet autoantibodies (1), and assessments of glucose tolerance (intravenous or oral glucose tolerance tests) has led to accurate prediction models for T1D development (3). Prospective birth cohort studies Diabetes Autoimmunity Study in the Young (DAISY) in Colorado (4), Type 1 Diabetes Prediction and Prevention (DIPP) study in Finland (5), and BABYDIAB studies in Germany have followed genetically at-risk children for the development of islet autoimmunity and T1D disease onset (6). These studies have been instrumental in understanding the natural history of T1D and making T1D a predictable disease with the measurement of antibodies in the peripheral blood directed against insulin and proteins within β-cells […]. Having two or more islet autoantibodies confers an ∼85% risk of developing T1D within 15 years and nearly 100% over time (7). […] T1D can be predicted by measuring islet autoantibodies, and thousands of individuals including young children are being identified through screening efforts, necessitating the need for treatments to delay and prevent disease onset.”
“Antigen-specific immunotherapies hold the promise of potentially inducing tolerance by inhibiting effector T cells and inducing regulatory T cells, which can act locally at tissue-specific sites of inflammation (12). Additionally, side effects are minimal with these therapies. As such, insulin and GAD have both been used as antigen-based approaches in T1D (13). Oral insulin has been evaluated in two large randomized double-blinded placebo-controlled trials over the last two decades. First in the Diabetes Prevention Trial–Type 1 (DPT-1) and then in the TrialNet clinical trials network […] The DPT-1 enrolled relatives at increased risk for T1D having islet autoantibodies […] After 6 years of treatment, there was no delay in T1D onset. […] The TrialNet study screened, enrolled, and followed 560 at-risk relatives over 9 years from 2007 to 2016, and results have been recently published (16). Unfortunately, this trial failed to meet the primary end point of delaying or preventing diabetes onset.”
“Many factors influence the potency and efficacy of antigen-specific therapy such as dose, frequency of dosing, route of administration, and, importantly, timing in the disease process. […] Over the last two decades, most T1D clinical trial designs have randomized participants 1:1 or 2:1, drug to placebo, in a double-blind two-arm design, especially those intervention trials in new-onset T1D (18). Primary end points have been delay in T1D onset for prevention trials or stimulated C-peptide area under the curve at 12 months with new-onset trials. These designs have served the field well and provided reliable human data for efficacy. However, there are limitations including the speed at which these trials can be completed, the number of interventions evaluated, dose optimization, and evaluation of mechanistic hypotheses. Alternative clinical trial designs, such as adaptive trial designs using Bayesian statistics, can overcome some of these issues. Adaptive designs use accumulating data from the trial to modify certain aspects of the study, such as enrollment and treatment group assignments. This “learn as we go” approach relies on biomarkers to drive decisions on planned trial modifications. […] One of the significant limitations for adaptive trial designs in the T1D field, at the present time, is the lack of validated biomarkers for short-term readouts to inform trial adaptations. However, large-scale collaborative efforts are ongoing to define biomarkers of T1D-specific immune dysfunction and β-cell stress and death (9,22).”
“T1D prevention has proven much more difficult than originally thought, challenging the paradigm that T1D is a single disease. T1D is indeed a heterogeneous disease in terms of age of diagnosis, islet autoantibody profiles, and the rate of loss of residual β-cell function after clinical onset. Children have a much more rapid loss of residual insulin production (measured as C-peptide area under the curve following a mixed-meal tolerance test) after diagnosis than older adolescents and adults (23,24), indicating that childhood and adult-onset T1D are not identical. Further evidence for subtypes of T1D come from studies of human pancreata of T1D organ donors in which children (0–14 years of age) within 1 year of diagnosis had many more inflamed islets compared with older adolescents and adults aged 15–39 years old (25). Additionally, a younger age of T1D onset (<7 years) has been associated with higher numbers of CD20+ B cells within islets and fewer insulin-containing islets compared with an age of onset ≥13 years associated with fewer CD20+ islet infiltrating cells and more insulin-containing islets (26,27). This suggests a much more aggressive autoimmune process in younger children and distinct endotypes (a subtype of a condition defined by a distinct pathophysiologic mechanism), which has recently been proposed for T1D (27).”
“Safe and specific therapies capable of being used in children are needed for T1D prevention. The vast majority of drug development involves small biotechnology companies, specialty pharmaceutical firms, and large pharmaceutical companies, more so than traditional academia. A large amount of preclinical and clinical research (phase 1, 2, and 3 studies) are needed to advance a drug candidate through the development pipeline to achieve U.S. Food and Drug Administration (FDA) approval for a given disease. A recent analysis of over 4,000 drugs from 835 companies in development during 2003–2011 revealed that only 10.4% of drugs that enter clinical development at phase 1 (safety studies) advance to FDA approval (32). However, the success rate increases 50% for the lead indication of a drug, i.e., a drug specifically developed for one given disease (32). Reasons for this include strong scientific rationale and early efficacy signals such as correlating pharmacokinetic (drug levels) to pharmacodynamic (drug target effects) tests for the lead indication. Lead indications also tend to have smaller, better-defined “homogenous” patient populations than nonlead indications for the same drug. This would imply that the T1D field needs more companies developing drugs specifically for T1D, not type 2 diabetes or other autoimmune diseases with later testing to broaden a drug’s indication. […] In a similar but separate analysis, selection biomarkers were found to substantially increase the success rate of drug approvals across all phases of drug development. Using a selection biomarker as part of study inclusion criteria increased drug approval threefold from 8.4% to 25.9% when used in phase 1 trials, 28% to 46% when transitioning from a phase 2 to phase 3 efficacy trial, and 55% to 76% for a phase 3 trial to likelihood of approval (33). These striking data support the concept that enrichment of patient enrollment at the molecular level is a more successful strategy than heterogeneous enrollment in clinical intervention trials. […] Taken together, new drugs designed specifically for children at risk for T1D and a biomarker selecting patients for a treatment response may increase the likelihood for a successful prevention trial; however, experimental confirmation in clinical trials is needed.”
…
v. Metabolic Karma — The Atherogenic Legacy of Diabetes: The 2017 Edwin Bierman Award Lecture.
“Cardiovascular (CV) disease remains the major cause of mortality and is associated with significant morbidity in both type 1 and type 2 diabetes (1–4). Despite major improvements in the management of traditional risk factors, including hypertension, dyslipidemia, and glycemic control prevention, retardation and reversal of atherosclerosis, as manifested clinically by myocardial infarction, stroke, and peripheral vascular disease, remain a major unmet need in the population with diabetes. For example, in the Steno-2 study and in its most recent report of the follow-up phase, at least a decade after cessation of the active treatment phase, there remained a high risk of death, primarily from CV disease despite aggressive control of the traditional risk factors, in this originally microalbuminuric population with type 2 diabetes (5,6). In a meta-analysis of major CV trials where aggressive glucose lowering was instituted […] the beneficial effect of intensive glycemic control on CV disease was modest, at best (7). […] recent trials with two sodium–glucose cotransporter 2 inhibitors, empagliflozin and canagliflozin (11,12), and two long-acting glucagon-like peptide 1 agonists, liraglutide and semaglutide (13,14), have reported CV benefits that have led in some of these trials to a decrease in CV and all-cause mortality. However, even with these recent positive CV outcomes, CV disease remains the major burden in the population with diabetes (15).”
“This unmet need of residual CV disease in the population with diabetes remains unexplained but may occur as a result of a range of nontraditional risk factors, including low-grade inflammation and enhanced thrombogenicity as a result of the diabetic milieu (16). Furthermore, a range of injurious pathways as a result of chronic hyperglycemia previously studied in vitro in endothelial cells (17) or in models of microvascular complications may also be relevant and are a focus of this review […] [One] major factor that is likely to promote atherosclerosis in the diabetes setting is increased oxidative stress. There is not only increased generation of ROS from diverse sources but also reduced antioxidant defense in diabetes (40). […] vascular ROS accumulation is closely linked to atherosclerosis and vascular inflammation provide the impetus to consider specific antioxidant strategies as a novel therapeutic approach to decrease CV disease, particularly in the setting of diabetes.”
“One of the most important findings from numerous trials performed in subjects with type 1 and type 2 diabetes has been the identification that previous episodes of hyperglycemia can have a long-standing impact on the subsequent development of CV disease. This phenomenon known as “metabolic memory” or the “legacy effect” has been reported in numerous trials […] The underlying explanation at a molecular and/or cellular level for this phenomenon remains to be determined. Our group, as well as others, has postulated that epigenetic mechanisms may participate in conferring metabolic memory (51–53). In in vitro studies initially performed in aortic endothelial cells, transient incubation of these cells in high glucose followed by subsequent return of these cells to a normoglycemic environment was associated with increased gene expression of the p65 subunit of NF-κB, NF-κB activation, and expression of NF-κB–dependent proteins, including MCP-1 and VCAM-1 (54).
In further defining a potential epigenetic mechanism that could explain the glucose-induced upregulation of genes implicated in vascular inflammation, a specific histone methylation mark was identified in the promoter region of the p65 gene (54). This histone 3 lysine 4 monomethylation (H3K4m1) occurred as a result of mobilization of the histone methyl transferase, Set7. Furthermore, knockdown of Set7 attenuated glucose-induced p65 upregulation and prevented the persistent upregulation of this gene despite these endothelial cells returning to a normoglycemic milieu (55). These findings, confirmed in animal models exposed to transient hyperglycemia (54), provide the rationale to consider Set7 as an appropriate target for end-organ protective therapies in diabetes. Although specific Set7 inhibitors are currently unavailable for clinical development, the current interest in drugs that block various enzymes, such as Set7, that influence histone methylation in diseases, such as cancer (56), could lead to agents that warrant testing in diabetes. Studies addressing other sites of histone methylation as well as other epigenetic pathways including DNA methylation and acetylation have been reported or are currently in progress (55,57,58), particularly in the context of diabetes complications. […] As in vitro and preclinical studies increase our knowledge and understanding of the pathogenesis of diabetes complications, it is likely that we will identify new molecular targets leading to better treatments to reduce the burden of macrovascular disease. Nevertheless, these new treatments will need to be considered in the context of improved management of traditional risk factors.”
…
vi. Perceived risk of diabetes seriously underestimates actual diabetes risk: The KORA FF4 study.
“According to the International Diabetes Federation (IDF), almost half of the people with diabetes worldwide are unaware of having the disease, and even in high-income countries, about one in three diabetes cases is not diagnosed [1,2]. In the USA, 28% of diabetes cases are undiagnosed [3]. In DEGS1, a recent population-based German survey, 22% of persons with HbA1c ≥ 6.5% were unaware of their disease [4]. Persons with undiagnosed diabetes mellitus (UDM) have a more than twofold risk of mortality compared to persons with normal glucose tolerance (NGT) [5,6]; many of them also have undiagnosed diabetes complications like retinopathy and chronic kidney disease [7,8]. […] early detection of diabetes and prediabetes is beneficial for patients, but may be delayed by patients´ being overly optimistic about their own health. Therefore, it is important to address how persons with UDM or prediabetes perceive their diabetes risk.”
“The proportion of persons who perceived their risk of having UDM at the time of the interview as “negligible”, “very low” or “low” was 87.1% (95% CI: 85.0–89.0) in NGT [normal glucose tolerance individuals], 83.9% (81.2–86.4) in prediabetes, and 74.2% (64.5–82.0) in UDM […]. The proportion of persons who perceived themselves at risk of developing diabetes in the following years ranged from 14.6% (95% CI: 12.6–16.8) in NGT to 20.6% (17.9–23.6) in prediabetes to 28.7% (20.5–38.6) in UDM […] In univariate regression models, perceiving oneself at risk of developing diabetes was associated with younger age, female sex, higher school education, obesity, self-rated poor general health, and parental diabetes […] the proportion of better educated younger persons (age ≤ 60 years) with prediabetes, who perceived themselves at risk of developing diabetes was 35%, whereas this figure was only 13% in less well educated older persons (age > 60 years).”
“The present study shows that three out of four persons with UDM [undiagnosed diabetes mellitus] believed that the probability of having undetected diabetes was low or very low. In persons with prediabetes, more than 70% believed that they were not at risk of developing diabetes in the next years. People with prediabetes were more inclined to perceive themselves at risk of diabetes if their self-rated general health was poor, their mother or father had diabetes, they were obese, they were female, their educational level was high, and if they were younger. […] People with undiagnosed diabetes or prediabetes considerably underestimate their probability of having or developing diabetes. […] perceived diabetes risk was lower in men, lower educated and older persons. […] Our results showed that people with low and intermediate education strongly underestimate their risk of diabetes and may qualify as target groups for detection of UDM and prediabetes.”
“The present results were in line with results from the Dutch Hoorn Study [18,19]. Adriaanse et al. reported that among persons with UDM, only 28.3% perceived their likeliness of having diabetes to be at least 10% [18], and among persons with high risk of diabetes (predicted from a symptom risk questionnaire), the median perceived likeliness of having diabetes was 10.8% [19]. Again, perceived risk did not fully reflect the actual risk profiles. For BMI, there was barely any association with perceived risk of diabetes in the Dutch study [19].”
100 Cases in Orthopaedics and Rheumatology (I)
This book was decent, but it’s not as good as some of the books I’ve previously read in this series; in some of the books in the series the average length of the answer section is 2-3 pages, which is a format I quite like, whereas in this book the average is more like 1-2 pages – which is a bit too short in my opinion.
Below I have added some links related to the first half of the book’s coverage and a few observations from the book.
…
Acute haematogenous osteomyelitis. (“There are two principal types of acute osteomyelitis: •haematogenous osteomyelitis •direct or contiguous inoculation osteomyelitis. Acute haematogenous osteomyelitis is characterized by an acute infection of the bone caused by the seeding of the bacteria within the bone from a remote source. This condition occurs primarily in children. […] In general, osteomyelitis has a bimodal age distribution. Acute haematogenous osteomyelitis is primarily a disease in children. Direct trauma and contiguous focus osteomyelitis are more common among adults and adolescents than in children. Spinal osteomyelitis is more common in individuals older than 45 years.”)
Haemophilic arthropathy. (“Haemophilic arthropathy is a condition associated with clotting disorder leading to recurrent bleeding in the joints. Over time this can lead to joint destruction.”)
Avascular necrosis of the femoral head. Trendelenburg’s sign. Gaucher’s disease. Legg–Calvé–Perthes disease. Ficat and Arlet classification of avascular necrosis of femoral head.
Osteosarcoma. Codman triangle. Enneking Classification. (“A firm, irregular mass fixed to underlying structures is more suspicious of a malignant lesion.”)
Ewing’s sarcoma. Haversian canal. (“This condition [ES] typically occurs in young patients and presents with pain and fever. [It] is the second most common primary malignant bone tumour (the first being osteosarcoma). The tumour is more common in males and affects children and young adults. The majority develop this between the ages of 10 and 20 years. […] The earliest symptom is pain, which is initially intermittent but becomes intense. Rarely, a patient may present with a pathological fracture. Eighty-five per cent of patients have chromosomal translocations associated with the 11/22 chromosome. Ewing’s sarcoma is potentially the most aggressive form of the primary bone tumours. […] Patients are usually assigned to one of two groups, the tumour being classified as either localized or metastatic disease. Tumours in the pelvis typically present late and are therefore larger with a poorer prognosis. Treatment comprises chemotherapy, surgical resection and/or radiotherapy. […] With localized disease, wide surgical excision of the tumour is preferred over radiotherapy if the involved bone is expendable (e.g. fibular, rib), or if radiotherapy would damage the growth plate. […] Non-metastatic disease survival rates are 55–70 per cent, compared to 22–33 per cent for metastatic disease. Patients require careful follow-up owing to the risk of developing osteosarcoma following radiotherapy, particularly in children in whom it can occur in up to 20 per cent of cases.”
Clavicle Fracture. Floating Shoulder.
Proximal humerus fractures.
Lateral condyle fracture of the humerus. Salter-Harris fracture. (“Humeral condyle fractures occur most commonly between 6 and 10 years of age. […] fractures often appear subtle on radiographs. […] Operative management is essential for all displaced fractures“).
Distal radius fracture. (“Colles’ fractures account for over 90 per cent of distal radius fractures. Any injury to the median nerve can produce paraesthesia in the thumb, index finger, and middle and radial border of the ring finger […]. There is a bimodal age distribution of fractures to the distal radius with two peaks occurring. The first peak occurs in people aged 18–25 years, and a second peak in older people (>65 years). High-energy injuries are more common in the younger group and low-energy injuries in the older group. Osteoporosis may play a role in the occurrence of this later fracture. In the group of patients between 60 and 69 years, women far outnumber men. […] Assessment with plain radiographs is all that is needed for most fractures. […] The majority of distal radius fractures can be treated conservatively.”)
Gamekeeper’s thumb. Stener lesion.
Subtrochanteric Hip Fracture.
Supracondylar Femur Fractures. (“There is a bimodal distribution of fractures based on age and gender. Most high-energy distal femur fractures occur in males aged between 15 and 50 years, while most low-energy fractures occur in osteoporotic women aged 50 or above. The most common high-energy mechanism of injury is a road traffic accident (RTA), and the most common low-energy mechanism is a fall. […] In general, […] non-operative treatment does not work well for displaced fractures. […] Operative intervention is also indicated in the presence of open fractures and injuries associated with vascular injury. […] Total knee replacement is effective in elderly patients with articular fractures and significant osteoporosis, or pre-existing arthritis that is not amenable to open reduction and internal fixation. Low-demand elderly patients with non- or minimally displaced fractures can be managed conservatively. […] In general, this fracture can take a minimum of 3-4 months to unite.”)
Supracondylar humerus fracture. Gartland Classification of Supracondylar Humerus Fractures. (“Prior to the treatment of supracondylar fractures, it is essential to identify the type. Examination of the degree of swelling and deformity as well as a neurological and vascular status assessment of the forearm is essential. A vascular injury may present with signs of an acute compartment syndrome with pain, paraesthesia, pallor, and pulseless and tight forearm. Injury to the brachial artery may present with loss of the distal pulse. However, in the presence of a weak distal pulse, major vessel injury may still be present owing to the collateral circulation. […] Vascular insult can lead to Volkmann ischaemic contracture of the forearm. […] Malunion of the fracture may lead to cubitus varus deformity.”)
Femoral Shaft Fractures.
Femoral Neck Fractures. Garden’s classification. (“Hip fractures are the most common reason for admission to an orthopaedic ward, usually caused by a fall by an elderly person. The average age of a person with a hip fracture is 77 years. Mortality is high: about 10 per cent of people with a hip fracture die within 1 month, and about one-third within 12 months. However, fewer than half of deaths are attributable to the fracture, reflecting the high prevalence of comorbidity. The mental status of the patient is also important: senility is associated with a three-fold increased risk of sepsis and dislocation of prosthetic replacement when compared with mentally alert patients. The one-year mortality rate in these patients is considerable, being reported as high as 50 per cent.”)
Tibia Shaft Fractures. (“The tibia is the most frequent site of a long-bone fracture in the body. […] Open fractures are surgical emergencies […] Most closed tibial fractures can be treated conservatively using plaster of Paris.”)
Tibial plateau fracture. Schatzker classification.
Compartment syndrome. (“This condition is an orthopaedic emergency and can be limb- and life-threatening. Compartment syndrome occurs when perfusion pressure falls below tissue pressure in a closed fascial compartment and results in microvascular compromise. At this point, blood flow through the capillaries stops. In the absence of flow, oxygen delivery stops. Hypoxic injury causes cells to release vasoactive substances (e.g. histamine, serotonin), which increase endothelial permeability. Capillaries allow continued fluid loss, which increases tissue pressure and advances injury. Nerve conduction slows, tissue pH falls due to anaerobic metabolism, surrounding tissue suffers further damage, and muscle tissue suffers necrosis, releasing myoglobin. In untreated cases the syndrome can lead to permanent functional impairment, renal failure secondary to rhabdomyolysis, and death. Patients at risk of compartment syndrome include those with high-velocity injuries, long-bone fractures, high-energy trauma, penetrating injuries such as gunshot wounds and stabbing, and crush injuries, as well as patients on anticoagulants with trauma. The patient usually complains of severe pain that is out of proportion to the injury. An assessment of the affected limb may reveal swelling which feels tense, or hard compartments. Pain on passive range of movement of fingers or toes of the affected limb is a typical feature. Late signs comprise pallor, paralysis, paraesthesia and a pulseless limb. Sensory nerves begin to lose conductive ability, followed by motor nerves. […] Fasciotomy is the definitive treatment for compartment syndrome. The purpose of fasciotomy is to achieve prompt and adequate decompression so as to restore the tissue perfusion.”)
Talus fracture. Hawkins sign. Avascular necrosis.
Calcaneal fracture. (“The most common situation leading to calcaneal fracture is a young adult who falls from a height and lands on his or her feet. […] Patients often sustain occult injuries to their lumbar or cervical spine, and the proximal femur. A thorough clinical and radiological investigation of the spine area is mandatory in patients with calcaneal fracture.”)
Idiopathic scoliosis. Adam’s forward bend test. Romberg test. Cobb angle.
Cauda equina syndrome. (“[Cauda equina syndrome] is an orthopaedic emergency. The condition is characterized by the red-flag signs comprising low back pain, unilateral or bilateral sciatica, saddle anaesthesia with sacral sparing, and bladder and bowel dysfunctions. Urinary retention is the most consistent finding. […] Urgent spinal orthopaedic or neurosurgical consulation is essential, with transfer to a unit capable of undertaking any definitive surgery considered necessary. In the long term, residual weakness, incontinence, impotence and/or sensory abnormalities are potential problems if therapy is delayed. […] The prognosis improves if a definitive cause is identified and appropriate surgical spinal decompression occurs early. Late surgical compression produces varying results and is often associated with a poorer outcome.”)
Developmental dysplasia of the hip.
Osteoarthritis. Arthroplasty. Osteotomy. Arthrodesis. (“Early-morning stiffness that gradually diminishes with activity is typical of osteoarthritis. […] Patients with hip pathology can sometimes present with knee pain without any groin or thigh symptoms. […] Osteoarthritis most commonly affects middle-aged and elderly patients. Any synovial joint can develop osteoarthritis. This condition can lead to degeneration of articular cartilage and is often associated with stiffness.”)
Prepatellar bursitis.
Baker’s cyst.
Meniscus tear. McMurray test. Apley’s test. Lachman test.
Anterior cruciate ligament injury.
Achilles tendon rupture. Thompson Test.
Congenital Talipes Equinovarus. Ponseti method. Pirani score. (“Club foot is bilateral in about 50 per cent of cases and occurs in approximately 1 in 800 births.”)
Charcot–Marie–Tooth disease. Pes cavus. Claw toe deformity. Pes planus.
Hallux valgus. Hallux Rigidus.
Mallet toe deformity. Condylectomy. Syme amputation. (“Mallet toes are common in diabetics with peripheral neuropathy. […] Pain and/or a callosity is often the presenting complaint. This may also lead to nail deformity on the toe. Most commonly the deformity is present in the second toe. […] Footwear modification […] should be tried first […] Surgical management of mallet toe is indicated if the deformity becomes painful.”)
Hammer Toe.
Lisfranc injury. Fleck sign. (“The Lisfranc joint, which represents the articulation between the midfoot and forefoot, is composed of the five TMT [tarsometatarsal] joints. […] A Lisfranc injury encompasses everything from a sprain to a complete disruption of normal anatomy through the TMT joints. […] Lisfranc injuries are commonly undiagnosed and carry a high risk of chronic secondary disability.”)
Charcot joint. (“Charcot arthropathy results in progressive destruction of bone and soft tissues at weight-bearing joints. In its most severe form it may cause significant disruption of the bony architecture, including joint dislocations and fractures. Charcot arthropathy can occur at any joint but most commonly affects the lower regions: the foot and ankle. Bilateral disease occurs in fewer than 10 per cent of patients. Any condition that leads to a sensory or autonomic neuropathy can cause a Charcot joint. Charcot arthropathy can occur as a complication of diabetes, syphilis, alcoholism, leprosy, meningomyleocele, spinal cord injury, syringomyelia, renal dialysis and congenital insensitivity to pain. In the majority of cases, non-operative methods are preferred. The principles of management are to provide immobilization of the affected joint and reduce any areas of stress on the skin. Immobilization is usually accomplished by casting.”)
Lateral epicondylitis (tennis elbow). (“For work-related lateral epicondylitis, a systematic review identified three risk factors: handling tools heavier than 1 kg, handling loads heavier than 20 kg at least ten times per day, and repetitive movements for more than two hours per day. […] Up to 95 per cent of patients with tennis elbow respond to conservative measures.”)
Medial Epicondylitis.
De Quervain’s tenosynovitis. Finkelstein test. Intersection syndrome. Wartenberg’s syndrome.
Trigger finger.
Adhesive capsulitis (‘frozen shoulder’). (“Frozen shoulder typically has three phases: the painful phase, the stiffening phase and the thawing phase. During the initial phase there is a gradual onset of diffuse shoulder pain lasting from weeks to months. The stiffening phase is characterized by a progressive loss of motion that may last up to a year. The majority of patients lose glenohumeral external rotation, internal rotation and abduction during this phase. The final, thawing phase ranges from weeks to months and constitutes a period of gradual motion improvement. Once in this phase, the patient may require up to 9 months to regain a fully functional range of motion. There is a higher incidence of frozen shoulder in patients with diabetes compared with the general population. The incidence among patients with insulin-dependent diabetes is even higher, with an increased frequency of bilateral frozen shoulder. Adhesive capsulitis has also been reported in patients with hyperthyroidism, ischaemic heart disease, and cervical spondylosis. Non-steroidal anti-inflammatory drugs (NSAIDs) are recommended in the initial treatment phase. […] A subgroup of patients with frozen shoulder syndrome often fail to improve despite conservative measures. In these cases, interventions such as manipulation, distension arthrography or open surgical release may be beneficial.” [A while back I covered some papers on adhesive capsulitis and diabetes here (part iii) – US].
Dupuytren’s Disease. (“Dupuytren’s contracture is a benign, slowly progressive fibroproliferative disease of the palmar fascia. […] The disease presents most commonly in the ring and little fingers and is bilateral in 45 per cent of cases. […] Dupuytren’s disease is more common in males and people of northern European origin. It can be associated with prior hand trauma, alcoholic cirrhosis, epilepsy (due to medications such as phenytoin), and diabetes. [“Dupuytren’s disease […] may be observed in up to 42% of adults with diabetes mellitus, typically in patients with long-standing T1D” – I usually don’t like such unspecific reported prevalences (what does ‘up to’ really mean?), but the point is that this is not a 1 in a 100 complication among diabetics; it seems to be a relatively common complication in type 1 DM – US] The prevalence increases with age. Mild cases may not need any treatment. Surgery is indicated in progressive contractures and established deformity […] Recurrence or extension of the disease after operation is not uncommon”).
Gastrointestinal complications of diabetes (I)
I really liked this book. It covered a lot of stuff also covered in Horowitz & Samsom’s excellent book on these topics, but it’s shorter and so probably easier for the relevant target group to justify reading. I recommend the book if you want to know more about these topics but don’t quite feel like reading a long textbook on these topics.
Below I’ve added some observations from the first half of the book. In the quotes below I’ve added some links and highlighted some key observations by the use of bold text.
…
“Gastrointestinal (GI) symptoms occur more commonly in patients with diabetes than in the general population [2]. […] GI symptoms such as nausea, abdominal pain, bloating, diarrhea, constipation, and delayed gastric emptying occur in almost 75 % of patients with diabetes [3]. A majority of patients with GI symptoms stay undiagnosed or undertreated due to a lack of awareness of these complications among clinicians. […] Diabetes can affect the entire GI tract from the oral cavity and esophagus to the large bowel and anorectal region, either in isolation or in a combination. The extent and the severity of the presenting symptoms may vary widely depending upon which part of the GI tract is involved. In patients with long-term type 1 DM, upper GI symptoms seem to be particularly common [4]. Of the different types […] gastroparesis seems to be the most well known and most serious complication, occurring in about 50 % of patients with diabetes-related GI complications [5].”
“The enteric nervous system (ENS) is an independent network of neurons and glial cells that spread from the esophagus up to the internal anal sphincter. […] the ENS regulates GI tract functions including motility, secretion, and participation in immune regulation [12, 13]. GI complications and their symptoms in patients with diabetes arise secondary to both abnormalities of gastric function (sensory and motor modality), as well as impairment of GI hormonal secretion [14], but these abnormalities are complex and incompletely understood. […] It has been known for a long time that diabetic autonomic neuropathy […] leads to abnormalities in the GI motility, sensation, secretion, and absorption, serving as the main pathogenic mechanism underlying GI complications. Recently, evidence has emerged to suggest that other processes might also play a role. Loss of the pacemaker interstitial cells of Cajal, impairment of the inhibitory nitric oxide-containing nerves, abnormal myenteric neurotransmission, smooth muscle dysfunction, and imbalances in the number of excitatory and inhibitory enteric neurons can drastically alter complex motor functions causing dysfunction of the enteric system [7, 11, 15, 16]. This dysfunction can further lead to the development of dysphagia and reflux esophagitis in the esophagus, gastroparesis, and dyspepsia in the stomach, pseudo-obstruction of the small intestine, and constipation, diarrhea, and incontinence in the colon. […] Compromised intestinal vascular flow arising due to ischemia and hypoxia from microvascular disease of the GI tract can also cause abdominal pain, bleeding, and mucosal dysfunction. Mitochondrial dysfunction has been implicated in the pathogenesis of gastric neuropathy. […] Another possible association between DM and the gastrointestinal tract can be infrequent autoimmune diseases associated with type I DM like autoimmune chronic pancreatitis, celiac disease (2–11 %), and autoimmune gastropathy (2 % prevalence in general population and three- to fivefold increase in patients with type 1 DM) [28, 29]. GI symptoms are often associated with the presence of other diabetic complications, especially autonomic and peripheral neuropathy [2, 30, 31]. In fact, patients with microvascular complications such as retinopathy, nephropathy, or neuropathy should be presumed to have GI abnormalities until proven otherwise. In a large cross-sectional questionnaire study of 1,101 subjects with DM, 57 % of patients reported at least one GI complication [31]. Poor glycemic control has also been found to be associated with increased severity of the upper GI symptoms. […] management of DM-induced GI complications is challenging, is generally suboptimal, and needs improvement.“
“Diabetes mellitus (DM) has multiple clinically important effects on the esophagus. Diabetes results in several esophageal motility disturbances, increases the risk of esophageal candidiasis, and increases the risk of Barrett’s esophagus and esophageal carcinoma. Finally, “black esophagus,” or acute esophageal necrosis, is also associated with DM. […] Esophageal dysmotility has been shown to be associated with diabetic neuropathy; however, symptomatic esophageal dysmotility is not often considered an important complication of diabetes. […] In general, the manometric effects of diabetes on the esophagus are not specific and mostly related to speed and strength of peristalsis. […] The pathological findings which amount to loss of cholinergic stimulation are consistent with the manometric findings in the esophagus, which are primarily related to slowed or weakened peristalsis. […] The association between DM and GERD is complex and conflicting. […] A recent meta-analysis suggests an overall positive association in Western countries [12]. […] The underlying pathogenesis of DM contributing to GERD is not fully elucidated, but is likely related to reduced acid clearance due to slow, weakened esophageal peristalsis. The association between DM and gastroesophageal reflux (GER) is well established, but the link between DM and GERD, which requires symptoms or esophagitis, is more complex because sensation may be blunted in diabetics with neuropathy. Asymptomatic gastroesophageal reflux (GER) confirmed by pH studies is significantly more frequent in diabetic patients than in healthy controls [13]. […] long-standing diabetics with neuropathy are at higher risk for GERD even if they have no symptoms. […] Abnormal pH and motility studies do not correlate very well with the GI symptoms of diabetics, possibly due to DM-related sensory dysfunction.”
“Gastroparesis is defined as a chronic disorder characterized by delayed emptying of the stomach occurring in the absence of mechanical obstruction. It is a well-known and potentially serious complication of diabetes. […] Diabetic gastroparesis affects up to 40 % of patients with type 1 diabetes and up to 30 % of patients with type 2 diabetes [1, 2]. Diabetic gastroparesis generally affects patients with longstanding diabetes mellitus, and patients often have other diabetic complications […] For reasons that remain unclear, approximately 80 % of patients with gastroparesis are women [3]. […] In diabetes, delayed gastric emptying can often be asymptomatic. Therefore, the term gastroparesis should only be reserved for patients that have both delayed gastric emptying and upper gastrointestinal symptoms. Additionally, discordance between the pattern and type of symptoms and the magnitude of delayed gastric emptying is a well-established phenomenon. Accelerating gastric emptying may not improve symptoms, and patients can have symptomatic improvement while gastric emptying time remains unchanged. Furthermore, patients with severe symptoms can have mild delays in gastric emptying. Clinical features of gastroparesis include nausea, vomiting, bloating, abdominal pain, and malnutrition. […] Gastroparesis affects oral drug absorption and can cause hyperglycemia that is challenging to manage, in addition to unexplained hypoglycemia. […] Nutritional and caloric deficits are common in patients with gastroparesis […] Possible complications of gastroparesis include volume depletion with renal failure, malnutrition, electrolyte abnormalities, esophagitis, Mallory–Weiss tear (from vomiting), or bezoar formation. […] Unfortunately, there is a dearth of medications available to treat gastroparesis. Additionally, many of the medications used are based on older trials with small sample sizes […and some of them have really unpleasant side effects – US]. […] Gastroparesis can be associated with abdominal pain in as many as 50 % of patients with gastroparesis at tertiary care centers. There are no trials to guide the choice of agents. […] Abdominal pain […] is often difficult to treat [3]. […] In a subset of patients with diabetes [less than 10%, according to Horowitz & Samsom – US], gastric emptying can be abnormally accelerated […]. Symptoms are often difficult to distinguish from those with delayed gastric emptying. […] Worsening symptoms with a prokinetic agent can be a sign of possible accelerated emptying.”
“Diabetic enteropathy encompasses small intestinal and colorectal dysfunctions such as diarrhea, constipation, and/or fecal incontinence. It is more commonly seen in patients with long-standing diabetes, especially in those with gastroparesis. Development of diabetic enteropathy is complex and multifactorial. […] gastrointestinal symptoms and complications do not always correlate with the duration of diabetes, glycemic control, or with the presence of autonomic neuropathy, which is often assumed to be the major cause of many gastrointestinal symptoms. Other pathophysiologic processes operative in diabetic enteropathy include enteric myopathy and neuropathy; however, causes of these abnormalities are unknown [1]. […] Collectively, the effects of diabetes on several targets cause aberrations in gastrointestinal function and regulation. Loss of ICC, autonomic neuropathy, and imbalances in the number of excitatory and inhibitory enteric neurons can drastically alter complex motor functions such as peristalsis, reflexive relaxation, sphincter tone, vascular flow, and intestinal segmentation [5]. […] Diarrhea is a common complaint in DM. […] Etiologies of diarrhea in diabetes are multifactorial and include rapid intestinal transit, drug-induced diarrhea, small-intestine bacterial overgrowth, celiac disease, pancreatic exocrine insufficiency, dietary factors, anorectal dysfunction, fecal incontinence, and microscopic colitis [1]. […] It is important to differentiate whether diarrhea is caused by rapid intestinal transit vs. SIBO. […] This differentiation has key clinical implications with regard to the use of antimotility agents or antibiotics in a particular case. […] Constipation is a common problem seen with long-standing DM. It is more common than in general population, where the incidence varies from 2 % to 30 % [30]. It affects 60 % of the patients with DM and is more common than diarrhea [14]. […] There are no specific treatments for diabetes-associated constipation […] In most cases, patients are treated in the same way as those with idiopathic chronic constipation. […] Colorectal cancer is the third most common cancer in men and the second in women [33]. Individuals with type 2 DM have an increased risk of colorectal cancer when compared with their nondiabetic counterparts […] According to a recent large observational population-based cohort study, type 2 DM was associated with a 1.3-fold increased risk of colorectal cancer compared to the general population.”
“Nonalcoholic fatty liver disease (NAFLD) is the main hepatic complication of obesity, insulin resistance, and diabetes and soon to become the leading cause for end-stage liver disease in the United States [1]. […] NAFLD is a spectrum of disease that ranges from steatosis (hepatic fat without significant hepatocellular injury) to nonalcoholic steatohepatitis (NASH; hepatic fat with hepatocellular injury) to advanced fibrosis and cirrhosis. As a direct consequence of the obesity epidemic, NAFLD is the most common cause of chronic liver disease, while NASH is the second leading indication for liver transplantation [1]. NAFLD prevalence is estimated at 25 % globally [2] and up to 30 % in the United States [3–5]. Roughly 30 % of individuals with NAFLD also have NASH, the progressive subtype of NAFLD. […] NASH is estimated at 22 % among patients with diabetes, compared to 5 % of the general population [4, 14]. […] Insulin resistance is strongly associated with NASH. […] Simple steatosis (also known as nonalcoholic fatty liver) is characterized by the presence of steatosis without ballooned hepatocytes (which represents hepatocyte injury) or fibrosis. Mild inflammation may be present. Simple steatosis is associated with a very low risk of progressive liver disease and liver-related mortality. […] Patients with NASH are at risk for progressive liver fibrosis and liver-related mortality, cardiovascular complications, and hepatocellular carcinoma (HCC) even in the absence of cirrhosis [26]. Liver fibrosis stage progresses at an estimated rate of one stage every 7 years [27]. Twenty percent of patients with NASH will eventually develop liver cirrhosis [9]. […] The risk of cardiovascular disease is increased across the entire NAFLD spectrum. […] Cardiovascular risk reduction should be aggressively managed in all patients.“
Robotics
“This book is not about the psychology or cultural anthropology of robotics, interesting as those are. I am an engineer and roboticist, so I confine myself firmly to the technology and application of real physical robots. […] robotics is the study of the design, application, and use of robots, and that is precisely what this Very Short Introduction is about: what robots do and what roboticists do.”
…
The above quote is from the book‘s preface; the book is quite decent and occasionally really quite fascinating. Below I have added some sample quotes and links to topics/stuff covered in the book.
…
“Some of all of […] five functions – sensing, signalling, moving, intelligence, and energy, integrated into a body – are present in all robots. The actual sensors, motors, and behaviours designed into a particular robot body shape depend on the job that robot is designed to do. […] A robot is: 1. an artificial device that can sense its environment and purposefully act on or in that environment; 2. an embodied artificial intelligence; or 3. a machine that can autonomously carry out useful work. […] Many real-world robots […] are not autonomous but remotely operated by humans. […] These are also known as tele-operated robots. […] From a robot design point of view, the huge advantage of tele-operated robots is that the human in the loop provides the robot’s ‘intelligence’. One of the most difficult problems in robotics — the design of the robot’s artificial intelligence — is therefore solved, so it’s not surprising that so many real-world robots are tele-operated. The fact that tele-operated robots alleviate the problem of AI design should not fool us into making the mistake of thinking that tele-operated robots are not sophisticated — they are. […] counter-intuitively, autonomous robots are often simpler than tele-operated robots […] When roboticists talk about autonomous robots they normally mean robots that decide what to do next entirely without human intervention or control. We need to be careful here because they are not talking about true autonomy, in the sense that you or I would regard ourselves as self-determining individuals, but what I would call ‘control autonomy’. By control autonomy I mean that the robot can undertake its task, or mission, without human intervention, but that mission is still programmed or commanded by a human. In fact, there are very few robots in use in the real world that are autonomous even in this limited sense. […] It is helpful to think about a spectrum of robot autonomy, from remotely operated at one end (no autonomy) to fully autonomous at the other. We can then place robots on this spectrum according to their degree of autonomy. […] On a scale of autonomy, a robot that can react on its own in response to its sensors is highly autonomous. A robot that cannot react, perhaps because it doesn’t have any sensors, is not.”
“It is […] important to note that autonomy and intelligence are not the same thing. A robot can be autonomous but not very smart, like a robot vacuum cleaner. […] A robot vacuum cleaner has a small number of preprogrammed (i.e. instinctive) behaviours and is not capable of any kind of learning […] These are characteristics we would associate with very simple animals. […] When roboticists describe a robot as intelligent, what they mean is ‘a robot that behaves, in some limited sense, as if it were intelligent’. The words as if are important here. […] There are basically two ways in which we can make a robot behave as if it is more intelligent: 1. preprogram a larger number of (instinctive) behaviours; and/or 2. design the robot so that it can learn and therefore develop and grow its own intelligence. The first of these approaches is fine, providing that we know everything there is to know about what the robot must do and all of the situations it will have to respond to while it is working. Typically we can only do this if we design both the robot and its operational environment. […] For unstructured environments, the first approach to robot intelligence above is infeasible simply because it’s impossible to anticipate every possible situation a robot might encounter, especially if it has to interact with humans. The only solution is to design a robot so that it can learn, either from its own experience or from humans or other robots, and therefore adapt and develop its own intelligence: in effect, grow its behavioural repertoire to be able to respond appropriately to more and more situations. This brings us to the subject of learning robots […] robot learning or, more generally, ‘machine learning’ — a branch of AI — has proven to be very much harder than was expected in the early days of Artificial Intelligence.”
“Robot arms on an assembly line are typically programmed to go through a fixed sequence of moves over and over again, for instance spot-welding car body panels, or spray-painting the complete car. These robots are therefore not intelligent. In fact, they often have no exteroceptive sensors at all. […] when we see an assembly line with multiple robot arms positioned on either side along a line, we need to understand that the robots are part of an integrated automated manufacturing system, in which each robot and the line itself have to be carefully programmed in order to coordinate and choreograph the whole operation. […] An important characteristic of assembly-line robots is that they require the working environment to be designed for and around them, i.e. a structured environment. They also need that working environment to be absolutely predictable and repeatable. […] Robot arms either need to be painstakingly programmed, so that the precise movement required of each joint is worked out and coded into a set of instructions for the robot arm or, more often (and rather more easily), ‘taught’ by a human using a control pad to move its end-effector (hand) to the required positions in the robot’s workspace. The robot then memorizes the set of joint movements so that they can be replayed (over and over again). The human operator teaching the robot controls the trajectory, i.e. the path the robot arm’s end-effector follows as it moves through its 3D workspace, and a set of mathematical equations called the ‘inverse kinematics’ converts the trajectory into a set of individual joint movements. Using this approach, it is relatively easy to teach a robot arm to pick up an object and move it smoothly to somewhere else in its workspace while keeping the object level […]. However […] most real-world robot arms are unable to sense the weight of the object and automatically adjust accordingly. They are simply designed with stiff enough joints and strong enough motors that, whatever the weight of the object (providing it’s within the robot’s design limits), it can be lifted, moved, and placed with equal precision. […] The robot arm and gripper are a foundational technology in robotics. Not only are they extremely important as […] industrial assembly-line robot[s], but they have become a ‘component’ in many areas of robotics.”
“Planetary rovers are tele-operated mobile robots that present the designer and operator with a number of very difficult challenges. One challenge is power: a planetary rover needs to be energetically self-sufficient for the lifetime of its mission, and must either be launched with a power source or — as in the case of the Mars rovers — fitted with solar panels capable of recharging the rover’s on-board batteries. Another challenge is dependability. Any mechanical fault is likely to mean the end of the rover’s mission, so it needs to be designed and built to exceptional standards of reliability and fail-safety, so that if parts of the rover should fail, the robot can still operate, albeit with reduced functionality. Extremes of temperature are also a problem […] But the greatest challenge is communication. With a round-trip signal delay time of twenty minutes to Mars and back, tele-operating the rover in real time is impossible. If the rover is moving and its human operator in the command centre on Earth reacts to an obstacle, it’s likely to be already too late; the robot will have hit the obstacle by the time the command signal to turn reaches the rover. An obvious answer to this problem would seem to be to give the rover a degree of autonomy so that it could, for instance, plan a path to a rock or feature of interest — while avoiding obstacles — then, when it arrives at the point of interest, call home and wait. Although path-planning algorithms capable of this level of autonomy have been well developed, the risk of a failure of the algorithm (and hence perhaps the whole mission) is deemed so high that in practice the rovers are manually tele-operated, at very low speed, with each manual manoeuvre carefully planned. When one also takes into account the fact that the Mars rovers are contactable only for a three-hour window per Martian day, a traverse of 100 metres will typically take up one day of operation at an average speed of 30 metres per hour.”
“The realization that the behaviour of an autonomous robot is an emergent property of its interactions with the world has important and far-reaching consequences for the way we design autonomous robots. […] when we design robots, and especially when we come to decide what behaviours to programme the robot’s AI with, we cannot think about the robot on its own. We must take into account every detail of the robot’s working environment. […] Like all machines, robots need power. For fixed robots, like the robot arms used for manufacture, power isn’t a problem because the robot is connected to the electrical mains supply. But for mobile robots power is a huge problem because mobile robots need to carry their energy supply around with them, with problems of both the size and weight of the batteries and, more seriously, how to recharge those batteries when they run out. For autonomous robots, the problem is acute because a robot cannot be said to be truly autonomous unless it has energy autonomy as well as computational autonomy; there seems little point in building a smart robot that ‘dies’ when its battery runs out. […] Localization is a[nother] major problem in mobile robotics; in other words, how does a robot know where it is, in 2D or 3D space. […] [One] type of robot learning is called reinforcement learning. […] it is a kind of conditioned learning. If a robot is able to try out several different behaviours, test the success or failure of each behaviour, then ‘reinforce’ the successful behaviours, it is said to have reinforcement learning. Although this sounds straightforward in principle, it is not. It assumes, first, that a robot has at least one successful behaviour in its list of behaviours to try out, and second, that it can test the benefit of each behaviour — in other words, that the behaviour has an immediate measurable reward. If a robot has to try every possible behaviour or if the rewards are delayed, then this kind of so-called ‘unsupervised’ individual robot learning is very slow.”
“A robot is described as humanoid if it has a shape or structure that to some degree mimics the human form. […] A small subset of humanoid robots […] attempt a greater degree of fidelity to the human form and appearance, and these are referred to as android. […] It is a recurring theme of this book that robot intelligence technology lags behind robot mechatronics – and nowhere is the mismatch between the two so starkly evident as it is in android robots. The problem is that if a robot looks convincingly human, then we (not unreasonably) expect it to behave like a human. For this reason whole-body android robots are, at the time of writing, disappointing. […] It is important not to overstate the case for humanoid robots. Without doubt, many potential applications of robots in human work- or living spaces would be better served by non-humanoid robots. The humanoid robot to use human tools argument doesn’t make sense if the job can be done autonomously. It would be absurd, for instance, to design a humanoid robot in order to operate a vacuum cleaner designed for humans. Similarly, if we want a driverless car, it doesn’t make sense to build a humanoid robot that sits in the driver’s seat. It seems that the case for humanoid robots is strongest when the robots are required to work alongside, learn from, and interact closely with humans. […] One of the most compelling reasons why robots should be humanoid is for those applications in which the robot has to interact with humans, work in human workspaces, and use tools or devices designed for humans.”
“…to put it bluntly, sex with a robot might not be safe. As soon as a robot has motors and moving parts, then assuring the safety of human-robot interaction becomes a difficult problem and if that interaction is intimate, the consequences of a mechanical or control systems failure could be serious.”
“All of the potential applications of humanoid robots […] have one thing in common: close interaction between human and robot. The nature of that interaction will be characterized by close proximity and communication via natural human interfaces – speech, gesture, and body language. Human and robot may or may not need to come into physical contact, but even when direct contact is not required they will still need to be within each other’s body space. It follows that robot safety, dependability, and trustworthiness are major issues for the robot designer. […] making a robot safe isn’t the same as making it trustworthy. One person trusts another if, generally speaking, that person is reliable and does what they say they will. So if I were to provide a robot that helps to look after your grandmother and I claim that it is perfectly safe — that it’s been designed to cover every risk or hazard — would you trust it? The answer is probably not. Trust in robots, just as in humans, has to be earned. […for more on these topics, see this post – US] […] trustworthiness cannot just be designed into the robot — it has to be earned by use and by experience. Consider a robot intended to fetch drinks for an elderly person. Imagine that the person calls for a glass of water. The robot then needs to fetch the drink, which may well require the robot to find a glass and fill it with water. Those tasks require sensing, dexterity, and physical manipulation, but they are problems that can be solved with current technology. The problem of trust arises when the robot brings the glass of water to the human. How does the robot give the glass to the human? If the robot has an arm so that it can hold out the glass in the same way a human would, how would the robot know when to let go? The robot clearly needs sensors in order to see and feel when the human has taken hold of the glass. The physical process of a robot handing something to a person is fraught with difficulty. Imagine, for instance, that the robot holds out its arm with the glass but the human can’t reach the glass. How does the robot decide where and how far it would be safe to bring its arm toward the person? What if the human takes hold of the glass but then the glass slips; does the robot let it fall or should it — as a human would — renew its grip on the glass? At what point would the robot decide the transaction has failed: it can’t give the glass of water to the person, or they won’t take it; perhaps they are asleep, or simply forgotten they wanted a glass of water, or confused. How does the robot sense that it should give up and perhaps call for assistance? These are difficult problems in robot cognition. Until they are solved, it’s doubtful we could trust a robot sufficiently well to do even a seemingly simple thing like handing over a glass of water.”
“The fundamental problem with Asimov’s laws of robotics, or any similar construction, is that they require the robot to make judgments. […] they assume that the robot is capable of some level of moral agency. […] No robot that we can currently build, or will build in the foreseeable future, is ‘intelligent’ enough to be able to even recognize, let alone make, these kinds of choices. […] Most roboticists agree that for the foreseeable future robots cannot be ethical, moral agents. […] precisely because, as we have seen, present-day ‘intelligent’ robots are not very intelligent, there is a danger of a gap between what robot users believe those robots to be capable of and what they are actually capable of. Given humans’ propensity to anthropomorphize and form emotional attachments to machines, there is clearly a danger that such vulnerabilities could be either unwittingly or deliberately exploited. Although robots cannot be ethical, roboticists should be.”
“In robotics research, the simulator has become an essential tool of the roboticist’s trade. The reason for this is that designing, building, and testing successive versions of real robots is both expensive and time-consuming, and if part of that work can be undertaken in the virtual rather than the real world, development times can be shortened, and the chances of a robot that works first time substantially improved. A robot simulator has three essential features. First, it must provide a virtual world. Second, it must offer a facility for creating a virtual model of the real robot. And third, it must allow the robot’s controller to be installed and ‘run’ on the virtual robot in the virtual world; the controller then determines how the robot behaves when running in the simulator. The simulator should also provide a visualization of the virtual world and simulated robots in it so that the designer can see what’s going on. […] These are difficult challenges for developers of robot simulators.”
“The next big step in miniaturization […] requires the solution of hugely difficult problems and, in all likelihood, the use of exotic approaches to design and fabrication. […] It is impossible to shrink mechanical and electrical components, or MEMS devices, in order to reduce total robot size to a few micrometres. In any event, the physics of locomotion through a fluid changes at the microscale and simply shrinking mechanical components from macro to micro — even if it were possible — would fail to address this problem. A radical approach is to leave behind conventional materials and components and move to a bioengineered approach in which natural bacteria are modified by adding artificial components. The result is a hybrid of artificial and natural (biological) components. The bacterium has many desirable properties for a microbot. By selecting a bacterium with a flagellum, we have locomotion perfectly suited to the medium. […] Another hugely desirable characteristic is that the bacteria are able to naturally scavenge for energy, thus avoiding the otherwise serious problem of powering the microbots. […] Whatever technology is used to create the microbots, huge problems would have to be overcome before a swarm of medical microbots could become a practical reality. The first is technical: how do surgeons or medical technicians reliably control and monitor the swarm while it’s working inside the body? Or, assuming we can give the microbots sufficient intelligence and autonomy (also a very difficult challenge), do we forgo precise control and human intervention altogether by giving the robots the swarm intelligence to be able to do the job, i.e. find the problem, fix it, then exit? […] these questions bring us to what would undoubtedly represent the greatest challenge: validating the swarm of medical microbots as effective, dependable, and above all safe, then gaining approval and public acceptance for its use. […] Do we treat the validation of the medical microbot swarm as an engineering problem, and attempt to apply the same kinds of methods we would use to validate safety-critical systems such as air traffic control systems? Or do we instead regard the medical microbot swarm as a drug and validate it with conventional and (by and large) trusted processes, including clinical trials, leading to approval and licensing for use? My suspicion is that we will need a new combination of both approaches.”
…
Links:
E-puck mobile robot.
Jacques de Vaucanson’s Digesting Duck.
Cybernetics.
Alan Turing. W. Ross Ashby. Norbert Wiener. Warren McCulloch. William Grey Walter.
Turtle (robot).
Industrial robot. Mechanical arm. Robotic arm. Robot end effector.
Automated guided vehicle.
Remotely operated vehicle. Unmanned aerial vehicle. Remotely operated underwater vehicle. Wheelbarrow (robot).
Robot-assisted surgery.
Lego Mindstorms NXT. NXT Intelligent Brick.
Biomimetic robots.
Artificial life.
Braitenberg vehicle.
Shakey the robot. Sense-Plan-Act. Rodney Brooks. A robust layered control system for a mobile robot.
Toto the robot.
Slugbot. Ecobot. Microbial fuel cell.
Scratchbot.
Simultaneous localization and mapping (SLAM).
Programming by demonstration.
Evolutionary algorithm.
NASA Robonaut. BERT 2. Kismet (robot). Jules (robot). Frubber. Uncanny valley.
AIBO. Paro.
Cronos Robot. ECCEROBOT.
Swarm robotics. S-bot mobile robot. Swarmanoid project.
Artificial neural network.
Symbrion.
Webots.
Kilobot.
Microelectromechanical systems. I-SWARM project.
ALICE (Artificial Linguistic Internet Computer Entity). BINA 48 (Breakthrough Intelligence via Neural Architecture 48).
Blood (II)
Below I have added some quotes from the chapters of the book I did not cover in my first post, as well as some supplementary links.
…
“Haemoglobin is of crucial biological importance; it is also easy to obtain safely in large quantities from donated blood. These properties have resulted in its becoming the most studied protein in human history. Haemoglobin played a key role in the history of our understanding of all proteins, and indeed the science of biochemistry itself. […] Oxygen transport defines the primary biological function of blood. […] Oxygen gas consists of two atoms of oxygen bound together to form a symmetrical molecule. However, oxygen cannot be transported in the plasma alone. This is because water is very poor at dissolving oxygen. Haemoglobin’s primary function is to increase this solubility; it does this by binding the oxygen gas on to the iron in its haem group. Every haem can bind one oxygen molecule, increasing the amount of oxygen able to dissolve in the blood.”
“An iron atom can exist in a number of different forms depending on how many electrons it has in its atomic orbitals. In its ferrous (iron II) state iron can bind oxygen readily. The haemoglobin protein has therefore evolved to stabilize its haem iron cofactor in this ferrous state. The result is that over fifty times as much oxygen is stored inside the confines of the red blood cell compared to outside in the watery plasma. However, using iron to bind oxygen comes at a cost. Iron (II) can readily lose one of its electrons to the bound oxygen, a process called ‘oxidation’. So the same form of iron that can bind oxygen avidly (ferrous) also readily reacts with that same oxygen forming an unreactive iron III state, called ‘ferric’. […] The complex structure of the protein haemoglobin is required to protect the ferrous iron from oxidizing. The haem iron is held in a precise configuration within the protein. Specific amino acids are ideally positioned to stabilize the iron–oxygen bond and prevent it from oxidizing. […] the iron stays ferrous despite the presence of the nearby oxygen. Having evolved over many hundreds of millions of years, this stability is very difficult for chemists to mimic in the laboratory. This is one reason why, desirable as it might be in terms of cost and convenience, it is not currently possible to replace blood transfusions with a simple small chemical iron oxygen carrier.”
“Given the success of the haem iron and globin combination in haemoglobin, it is no surprise that organisms have used this basic biochemical architecture for a variety of purposes throughout evolution, not just oxygen transport in blood. One example is the protein myoglobin. This protein resides inside animal cells; in the human it is found in the heart and skeletal muscle. […] Myoglobin has multiple functions. Its primary role is as an aid to oxygen diffusion. Whereas haemoglobin transports oxygen from the lung to the cell, myoglobin transports it once it is inside the cell. As oxygen is so poorly soluble in water, having a chain of molecules inside the cell that can bind and release oxygen rapidly significantly decreases the time it takes the gas to get from the blood capillary to the part of the cell—the mitochondria—where it is needed. […] Myoglobin can also act as an emergency oxygen backup store. In humans this is trivial and of questionable importance. Not so in diving mammals such as whales and dolphins that have as much as thirty times the myoglobin content of the terrestrial equivalent; indeed those mammals that dive for the longest duration have the most myoglobin. […] The third known function of myoglobin is to protect the muscle cells from damage by nitric oxide gas.”
“The heart is the organ that pumps blood around the body. If the heart stops functioning, blood does not flow. The driving force for this flow is the pressure difference between the arterial blood leaving the heart and the returning venous blood. The decreasing pressure in the venous side explains the need for unidirectional valves within veins to prevent the blood flowing in the wrong direction. Without them the return of the blood through the veins to the heart would be too slow, especially when standing up, when the venous pressure struggles to overcome gravity. […] normal [blood pressure] ranges rise slowly with age. […] high resistance in the arterial circulation at higher blood pressures [places] additional strain on the left ventricle. If the heart is weak, it may fail to achieve the extra force required to pump against this resistance, resulting in heart failure. […] in everyday life, a low blood pressure is rarely of concern. Indeed, it can be a sign of fitness as elite athletes have a much lower resting blood pressure than the rest of the population. […] the effect of exercise training is to thicken the muscles in the walls of the heart and enlarge the chambers. This enables more blood to be pumped per beat during intense exercise. The consequence of this extra efficiency is that when an athlete is resting—and therefore needs no more oxygen than a more sedentary person—the heart rate and blood pressure are lower than average. Most people’s experience of hypotension will be reflected by dizzy spells and lack of balance, especially when moving quickly to an upright position. This is because more blood pools in the legs when you stand up, meaning there is less blood for the heart to pump. The immediate effect should be for the heart to beat faster to restore the pressure. If there is a delay, the decrease in pressure can decrease the blood flow to the brain and cause dizziness; in extreme cases this can lead to fainting.”
“If hypertension is persistent, patients are most likely to be treated with drugs that target specific pathways that the body uses to control blood pressure. For example angiotensin is a protein that can trigger secretion of the hormone aldosterone from the adrenal gland. In its active form angiotensin can directly constrict blood vessels, while aldosterone enhances salt and water retention, so raising blood volume. Both these effects increase blood pressure. Angiotensin is converted into its active form by an enzyme called ‘Angiotensin Converting Enzyme’ (ACE). An ACE inhibitor drug prevents this activity, keeping angiotensin in its inactive form; this will therefore drop the patient’s blood pressure. […] The metal calcium controls many processes in the body. Its entry into muscle cells triggers muscle contraction. Preventing this entry can therefore reduce the force of contraction of the heart and the ability of arteries to constrict. Both of these will have the effect of decreasing blood pressure. Calcium enters muscle cells via specific protein-based channels. Drugs that block these channels (calcium channel blockers) are therefore highly effective at treating hypertension.”
“Autoregulation is a homeostatic process designed to ensure that blood flow remains constant [in settings where constancy is desirable]. However, there are many occasions when an organism actively requires a change in blood flow. It is relatively easy to imagine what these are. In the short term, blood supplies oxygen and nutrients. When these are used up rapidly, or their supply becomes limited, the response will be to increase blood flow. The most obvious example is the twenty-fold increase in oxygen and glucose consumption that occurs in skeletal muscle during exercise when compared to rest. If there were no accompanying increase in blood flow to the muscle the oxygen supply would soon run out. […] There are hundreds of molecules known that have the ability to increase or decrease blood flow […] The surface of all blood vessels is lined by a thin layer of cells, the ‘endothelium’. Endothelial cells form a barrier between the blood and the surrounding tissue, controlling access of materials into and out of the blood. For example white blood cells can enter or leave the circulation via interacting with the endothelium; this is the route by which neutrophils migrate from the blood to the site of tissue damage or bacterial/viral attack as part of the innate immune response. However, the endothelium is not just a selective barrier. It also plays an active role in blood physiology and biochemistry.”
“Two major issues [related to blood transfusions] remained at the end of the 19th century: the problem of clotting, which all were aware of; and the problem of blood group incompatbility, which no one had the slightest idea even existed. […] For blood transfusions to ever make a recovery the key issues of blood clotting and adverse side effects needed to be resolved. In 1875 the Swedish biochemist Olof Hammarsten showed that adding calcium accelerated the rate of blood clotting (we now know the mechanism for this is that key enzymes in blood platelets that catalyse fibrin formation require calcium for their function). It therefore made sense to use chemicals that bind calcium to try to prevent clotting. Calcium ions are positively charged; adding negatively charged ions such as oxalate and citrate neutralized the calcium, preventing its clot-promoting action. […] At the same time as anticoagulants were being discovered, the reason why some blood transfusions failed even when there were no clots was becoming clear. It had been shown that animal blood given to humans tended to clump together or agglutinate, eventually bursting and releasing free haemoglobin and causing kidney damage. In the early 1900s, working in Vienna, Karl Landsteiner showed the same effect could occur with human-to-human transfusion. The trick was the ability to separate blood cells from serum. This enabled mixing blood cells from a variety of donors with plasma from a variety of participants. Using his laboratory staff as subjects, Landsteiner showed that only some combinations caused the agglutination reaction. Some donor cells (now known as type O) never clumped. Others clumped depending on the nature of the plasma in a reproducible manner. A careful study of Landsteiner’s results revealed the ABO blood type distinctions […]. Versions of these agglutination tests still form the basis of checking transfused blood today.”
“No blood product can be made completely sterile, no matter how carefully it is processed. The best that can be done is to ensure that no new bacteria or viruses are added during the purification, storage, and transportation processes. Nothing can be done to inactivate any viruses that are already present in the donor’s blood, for the harsh treatments necessary to do this would inevitably damage the viability of the product or be prohibitively expensive to implement on the industrial scale that the blood market has become. […] In the 1980s over half the US haemophiliac population was HIV positive.”
“Three fundamentally different ways have been attempted to replace red blood cell transfusions. The first uses a completely chemical approach and makes use of perfluorocarbons, inert chemicals that, in liquid form, can dissolve gasses without reacting with them. […] Perfluorocarbons can dissolve oxygen much more effectively than water. […] The problem with their use as a blood substitute is that the amount of oxygen dissolved in these solutions is linear with increasing pressure. This means that the solution lacks the advantages of the sigmoidal binding curve of haemoglobin, which has evolved to maximize the amount of oxygen captured from the limited fraction found in air (20 per cent oxygen). However, to deliver the same amount of oxygen as haemoglobin, patients using the less efficient perfluorocarbons in their blood need to breathe gas that is almost 100 per cent pure oxygen […]; this restricts the use of these compounds. […] The second type of blood substitute makes use of haemoglobin biology. Initial attempts used purified haemoglobin itself. […] there is no haemoglobin-based blood substitute in general use today […] The problem for the lack of uptake is not that blood substitutes cannot replace red blood cell function. A variety of products have been shown to stay in the vasculature for several days, provide volume support, and deliver oxygen. However, they have suffered due to adverse side effects, most notably cardiac complications. […] In nature the plasma proteins haptoglobin and haemopexin bind and detoxify any free haemoglobin and haem released from red blood cells. The challenge for blood substitute research is to mimic these effects in a product that can still deliver oxygen. […] Despite ongoing research, these problems may prove to be insurmountable. There is therefore interest in a third approach. This is to grow artificial red blood cells using stem cell technology.”
…
Links:
Porphyrin. Globin.
Felix Hoppe-Seyler. Jacques Monod. Jeffries Wyman. Jean-Pierre Changeux.
Allosteric regulation. Monod-Wyman-Changeux model.
Structural Biochemistry/Hemoglobin (wikibooks). (Many of the topics covered in this link – e.g. comments on affinity, T/R-states, oxygen binding curves, the Bohr effect, etc. – are also covered in the book, so although I do link to some of the other topics also covered in this link below it should be noted that I did in fact leave out quite a few potentially relevant links on account of those topics being covered in the above link).
1,3-Bisphosphoglycerate.
Erythrocruorin.
Haemerythrin.
Hemocyanin.
Cytoglobin.
Neuroglobin.
Sickle cell anemia. Thalassaemia. Hemoglobinopathy. Porphyria.
Pulse oximetry.
Daniel Bernoulli. Hydrodynamica. Stephen Hales. Karl von Vierordt.
Arterial line.
Sphygmomanometer. Korotkoff sounds. Systole. Diastole. Blood pressure. Mean arterial pressure. Hypertension. Antihypertensive drugs. Atherosclerosis Pathology. Beta blocker. Diuretic.
Autoregulation.
Guanylate cyclase. Glyceryl trinitrate.
Blood transfusion. Richard Lower. Jean-Baptiste Denys. James Blundell.
Parabiosis.
Penrose Inquiry.
ABLE (Age of Transfused Blood in Critically Ill Adults) trial.
RECESS trial.
Molecular biology (III)
Below I have added a few quotes and links related to the last few chapters of the book‘s coverage.
…
“Normal ageing results in part from exhaustion of stem cells, the cells that reside in most organs to replenish damaged tissue. As we age DNA damage accumulates and this eventually causes the cells to enter a permanent non-dividing state called senescence. This protective ploy however has its downside as it limits our lifespan. When too many stem cells are senescent the body is compromised in its capacity to renew worn-out tissue, causing the effects of ageing. This has a knock-on effect of poor intercellular communication, mitochondrial dysfunction, and loss of protein balance (proteostasis). Low levels of chronic inflammation also increase with ageing and could be the trigger for changes associated with many age-related disorders.”
“There has been a dramatic increase in ageing research using yeast and invertebrates, leading to the discovery of more ‘ageing genes’ and their pathways. These findings can be extrapolated to humans since longevity pathways are conserved between species. The major pathways known to influence ageing have a common theme, that of sensing and metabolizing nutrients. […] The field was advanced by identification of the mammalian Target Of Rapamycin, aptly named mTOR. mTOR acts as a molecular sensor that integrates growth stimuli with nutrient and oxygen availability. Small molecules such as rapamycin that reduce mTOR signalling act in a similar way to severe dietary restriction in slowing the ageing process in organisms such as yeast and worms. […] Rapamycin and its derivatives (rapalogs) have been involved in clinical trials on reducing age-related pathologies […] Another major ageing pathway is telomere maintenance. […] Telomere attrition is a hallmark of ageing and studies have established an association between shorter telomere length (TL) and the risk of various common age-related ailments […] Telomere loss is accelerated by known determinants of ill health […] The relationship between TL and cancer appears complex.”
“Cancer is not a single disease but a range of diseases caused by abnormal growth and survival of cells that have the capacity to spread. […] One of the early stages in the acquisition of an invasive phenotype is epithelial-mesenchymal transition (EMT). Epithelial cells form skin and membranes and for this they have a strict polarity (a top and a bottom) and are bound in position by close connections with adjacent cells. Mesenchymal cells on the other hand are loosely associated, have motility, and lack polarization. The transition between epithelial and mesenchymal cells is a normal process during embryogenesis and wound healing but is deregulated in cancer cells. EMT involves transcriptional reprogramming in which epithelial structural proteins are lost and mesenchymal ones acquired. This facilitates invasion of a tumour into surrounding tissues. […] Cancer is a genetic disease but mostly not inherited from the parents. Normal cells evolve to become cancer cells by acquiring successive mutations in cancer-related genes. There are two main classes of cancer genes, the proto-oncogenes and the tumour suppressor genes. The proto-oncogenes code for protein products that promote cell proliferation. […] A mutation in a proto-oncogene changes it to an ‘oncogene’ […] One gene above all others is associated with cancer suppression and that is TP53. […] approximately half of all human cancers carry a mutated TP53 and in many more, p53 is deregulated. […] p53 plays a key role in eliminating cells that have either acquired activating oncogenes or excessive genomic damage. Thus mutations in the TP53 gene allows cancer cells to survive and divide further by escaping cell death […] A mutant p53 not only lacks the tumour suppressor functions of the normal or wild type protein but in many cases it also takes on the role of an oncogene. […] Overall 5-10 per cent of cancers occur due to inherited or germ line mutations that are passed from parents to offspring. Many of these genes code for DNA repair enzymes […] The vast majority of cancer mutations are not inherited; instead they are sporadic with mutations arising in somatic cells. […] At least 15 per cent of cancers are attributable to infectious agents, examples being HPV and cervical cancer, H. pylori and gastric cancer, and also hepatitis B or C and liver cancer.”
“There are about 10 million different sites at which people can vary in their DNA sequence withing the 3 billion bases in our DNA. […] A few, but highly variable sequences or minisatellites are chosen for DNA profiling. These give a highly sensitive procedure suitable for use with small amounts of body fluids […] even shorter sequences called microsatellite repeats [are also] used. Each marker or microsatellite is a short tandem repeat (STR) of two to five base pairs of DNA sequence. A single STR will be shared by up to 20 per cent of the population but by using a dozen or so identification markers in profile, the error is miniscule. […] Microsatellites are extremely useful for analysing low-quality or degraded DNA left at a crime scene as their short sequences are usually preserved. However, DNA in specimens that have not been optimally preserved persists in exceedingly small amounts and is also highly fragmented. It is probably also riddled by contamination and chemical damage. Such sources of DNA sources of DNA are too degraded to obtain a profile using genomic STRs and in these cases mitochondrial DNA, being more abundant, is more useful than nuclear DNA for DNA profiling. […] Mitochondrial DNA profiling is the method of choice for determining the identities of missing or unknown people when a maternally linked relative can be found. Molecular biologists can amplify hypervariable regions of mitochondrial DNA by PCR to obtain enough material for analysis. The DNA products are sequenced and single nucleotide differences are sought with a reference DNA from a maternal relative. […] It has now become possible for […] ancient DNA to reveal much more than genotype matches. […] Pigmentation characteristics can now be determined from ancient DNA since skin, hair, and eye colour are some of the easiest characteristics to predict. This is due to the limited number of base differences or SNPs required to explain most of the variability.”
“A broad range of debilitating and fatal conditions, non of which can be cured, are associated with mitochondrial DNA mutations. […] [M]itochondrial DNA mutates ten to thirty times faster than nuclear DNA […] Mitochondrial DNA mutates at a higher rate than nuclear DNA due to higher numbers of DNA molecules and reduced efficiency in controlling DNA replication errors. […] Over 100,000 copies of mitochondrial DNA are present in the cytoplasm of the human egg or oocyte. After fertilization, only maternal mitochondria survive; the small numbers of the father’s mitochondria in the zygote are targeted for destruction. Thus all mitochondrial DNA for all cell types in the resulting embryo is maternal-derived. […] Patients affected by mitochondrial disease usually have a mixture of wild type (normal) and mutant mitochondrial DNA and the disease severity depends on the ratio of the two. Importantly the actual level of mutant DNA in a mother’s heteroplas[m]y […curiously the authors throughout the coverage insist on spelling this ‘heteroplasty’, which according to google is something quite different – I decided to correct the spelling error (?) here – US] is not inherited and offspring can be better or worse off than the mother. This also causes uncertainty since the ratio of wild type to mutant mitochondria may change during development. […] Over 700 mutations in mitochondrial DNA have been found leading to myopathies, neurodegeneration, diabetes, cancer, and infertility.”
…
Links:
Dementia. Alzheimer’s disease. Amyloid hypothesis. Tau protein. Proteopathy. Parkinson’s disease. TP53-inducible glycolysis and apoptosis regulator (TIGAR).
Progeria. Progerin. Werner’s syndrome. Xeroderma pigmentosum. Cockayne syndrome.
Shelterin.
Telomerase.
Alternative lengthening of telomeres: models, mechanisms and implications (Nature).
Coats plus syndrome.
Neoplasia. Tumor angiogenesis. Inhibitor protein MDM2.
Li–Fraumeni syndrome.
Non-coding RNA networks in cancer (Nature).
Cancer stem cell. (“The reason why current cancer therapies often fail to eradicate the disease is that the CSCs survive current DNA damaging treatments and repopulate the tumour.” See also this IAS lecture which covers closely related topics – US.)
Imatinib.
Restriction fragment length polymorphism (RFLP).
CODIS.
MC1R.
Archaic human admixture with modern humans.
El Tor strain.
DNA barcoding.
Hybrid breakdown/-inviability.
Trastuzumab.
Digital PCR.
Pearson’s syndrome.
Mitochondrial replacement therapy.
Synthetic biology.
Artemisinin.
Craig Venter.
Genome editing.
Indel.
CRISPR.
Tyrosinemia.
Recent Comments
Sabra Zaraa on Cost-effectiveness analysis in… adityaguharoy on Combinatorics (I) therookswinger on Magnus Carlsen playing bullet… Stefan on Quotes US on Quotes Goodreads Quotes
Usfromdk’s quotes
"Happiness and its anticipation are […] proximate mechanisms that lead us to perform and repeat acts that in the environments of history, at least, would have led to greater reproductive success." (Richard D. Alexander)Statcounter
