Links and random stuff
i. Pulmonary Aspects of Exercise and Sports.
“Although the lungs are a critical component of exercise performance, their response to exercise and other environmental stresses is often overlooked when evaluating pulmonary performance during high workloads. Exercise can produce capillary leakage, particularly when left atrial pressure increases related to left ventricular (LV) systolic or diastolic failure. Diastolic LV dysfunction that results in elevated left atrial pressure during exercise is particularly likely to result in pulmonary edema and capillary hemorrhage. Data from race horses, endurance athletes, and triathletes support the concept that the lungs can react to exercise and immersion stress with pulmonary edema and pulmonary hemorrhage. Immersion in water by swimmers and divers can also increase stress on pulmonary capillaries and result in pulmonary edema.”
“Zavorsksy et al.11 studied individuals under several different workloads and performed lung imaging to document the presence or absence of lung edema. Radiographic image readers were blinded to the exposures and reported visual evidence of lung fluid. In individuals undergoing a diagnostic graded exercise test, no evidence of lung edema was noted. However, 15% of individuals who ran on a treadmill at 70% of maximum capacity for 2 hours demonstrated evidence of pulmonary edema, as did 65% of those who ran at maximum capacity for 7 minutes. Similar findings were noted in female athletes.12 Pingitore et al. examined 48 athletes before and after completing an iron man triathlon. They used ultrasound to detect lung edema and reported the incidence of ultrasound lung comets.13 None of the athletes had evidence of lung edema before the event, while 75% showed evidence of pulmonary edema immediately post-race, and 42% had persistent findings of pulmonary edema 12 hours post-race. Their data and several case reports14–16 have demonstrated that extreme exercise can result in pulmonary edema”
“Conclusions
Sports and recreational participation can result in lung injury caused by high pulmonary pressures and increased blood volume that raises intracapillary pressure and results in capillary rupture with subsequent pulmonary edema and hemorrhage. High-intensity exercise can result in accumulation of pulmonary fluid and evidence of pulmonary edema. Competitive swimming can result in both pulmonary edema related to fluid shifts into the thorax from immersion and elevated LV end diastolic pressure related to diastolic dysfunction, particularly in the presence of high-intensity exercise. […] The most important approach to many of these disorders is prevention. […] Prevention strategies include avoiding extreme exercise, avoiding over hydration, and assuring that inspiratory resistance is minimized.”
…
ii. Some interesting thoughts on journalism and journalists from a recent SSC Open Thread by user ‘Well’ (quotes from multiple comments). His/her thoughts seem to line up well with my own views on these topics, and one of the reasons why I don’t follow the news is that my own answer to the first question posed below is quite briefly that, ‘…well, I don’t’:
“I think a more fundamental problem is the irrational expectation that newsmedia are supposed to be a reliable source of information in the first place. Why do we grant them this make-believe power?
The English and Acting majors who got together to put on the shows in which they pose as disinterested arbiters of truth use lots of smoke and mirror techniques to appear authoritative: they open their programs with regal fanfare, they wear fancy suits, they make sure to talk or write in a way that mimics the disinterestedness of scholarly expertise, they appear with spinning globes or dozens of screens behind them as if they’re omniscient, they adorn their publications in fancy black-letter typefaces and give them names like “Sentinel” and “Observer” and “Inquirer” and “Plain Dealer”, they invented for themselves the title of “journalists” as if they take part in some kind of peer review process… But why do these silly tricks work? […] what makes the press “the press” is the little game of make-believe we play where an English or Acting major puts on a suit, talks with a funny cadence in his voice, sits in a movie set that looks like God’s Control Room, or writes in a certain format, using pseudo-academic language and symbols, and calls himself a “journalist” and we all pretend this person is somehow qualified to tell us what is going on in the world.
Even when the “journalist” is saying things we agree with, why do we participate in this ridiculous charade? […] I’m not against punditry or people putting together a platform to talk about things that happen. I’m against people with few skills other than “good storyteller” or “good writer” doing this while painting themselves as “can be trusted to tell you everything you need to know about anything”. […] Inasumuch as what I’m doing can be called “defending” them, I’d “defend” them not because they are providing us with valuable facts (ha!) but because they don’t owe us facts, or anything coherent, in the first place. It’s not like they’re some kind of official facts-providing service. They just put on clothes to look like one.”
…
iii. Chatham house rule.
…
iv. Sex Determination: Why So Many Ways of Doing It?
“Sexual reproduction is an ancient feature of life on earth, and the familiar X and Y chromosomes in humans and other model species have led to the impression that sex determination mechanisms are old and conserved. In fact, males and females are determined by diverse mechanisms that evolve rapidly in many taxa. Yet this diversity in primary sex-determining signals is coupled with conserved molecular pathways that trigger male or female development. Conflicting selection on different parts of the genome and on the two sexes may drive many of these transitions, but few systems with rapid turnover of sex determination mechanisms have been rigorously studied. Here we survey our current understanding of how and why sex determination evolves in animals and plants and identify important gaps in our knowledge that present exciting research opportunities to characterize the evolutionary forces and molecular pathways underlying the evolution of sex determination.”
…
v. So Good They Can’t Ignore You.
“Cal Newport’s 2012 book So Good They Can’t Ignore You is a career strategy book designed around four ideas.
The first idea is that ‘follow your passion’ is terrible career advice, and people who say this should be shot don’t know what they’re talking about. […] The second idea is that instead of believing in the passion hypothesis, you should adopt what Newport calls the ‘craftsman mindset’. The craftsman mindset is that you should focus on gaining rare and valuable skills, since this is what leads to good career outcomes.
The third idea is that autonomy is the most important component of a ‘dream’ job. Newport argues that when choosing between two jobs, there are compelling reasons to ‘always’ pick the one with higher autonomy over the one with lower autonomy.
The fourth idea is that having a ‘mission’ or a ‘higher purpose’ in your job is probably a good idea, and is really nice if you can find it. […] the book structure is basically: ‘following your passion is bad, instead go for Mastery[,] Autonomy and Purpose — the trio of things that have been proven to motivate knowledge workers’.” […]
“Newport argues that applying deliberate practice to your chosen skill market is your best shot at becoming ‘so good they can’t ignore you’. The key is to stretch — you want to practice skills that are just above your current skill level, so that you experience discomfort — but not too much discomfort that you’ll give up.” […]
“Newport thinks that if your job has one or more of the following qualities, you should leave your job in favour of another where you can build career capital:
- Your job presents few opportunities to distinguish yourself by developing relevant skills that are rare and valuable.
- Your job focuses on something you think is useless or perhaps even actively bad for the world.
- Your job forces you to work with people you really dislike.
If you’re in a job with any of these traits, your ability to gain rare and valuable skills would be hampered. So it’s best to get out.”
…
vi. Structural brain imaging correlates of general intelligence in UK Biobank.
“The association between brain volume and intelligence has been one of the most regularly-studied—though still controversial—questions in cognitive neuroscience research. The conclusion of multiple previous meta-analyses is that the relation between these two quantities is positive and highly replicable, though modest (Gignac & Bates, 2017; McDaniel, 2005; Pietschnig, Penke, Wicherts, Zeiler, & Voracek, 2015), yet its magnitude remains the subject of debate. The most recent meta-analysis, which included a total sample size of 8036 participants with measures of both brain volume and intelligence, estimated the correlation at r = 0.24 (Pietschnig et al., 2015). A more recent re-analysis of the meta-analytic data, only including healthy adult samples (N = 1758), found a correlation of r = 0.31 (Gignac & Bates, 2017). Furthermore, the correlation increased as a function of intelligence measurement quality: studies with better-quality intelligence tests—for instance, those including multiple measures and a longer testing time—tended to produce even higher correlations with brain volume (up to 0.39). […] Here, we report an analysis of data from a large, single sample with high-quality MRI measurements and four diverse cognitive tests. […] We judge that the large N, study homogeneity, and diversity of cognitive tests relative to previous large scale analyses provides important new evidence on the size of the brain structure-intelligence correlation. By investigating the relations between general intelligence and characteristics of many specific regions and subregions of the brain in this large single sample, we substantially exceed the scope of previous meta-analytic work in this area. […]
“We used a large sample from UK Biobank (N = 29,004, age range = 44–81 years). […] This preregistered study provides a large single sample analysis of the global and regional brain correlates of a latent factor of general intelligence. Our study design avoids issues of publication bias and inconsistent cognitive measurement to which meta-analyses are susceptible, and also provides a latent measure of intelligence which compares favourably with previous single-indicator studies of this type. We estimate the correlation between total brain volume and intelligence to be r = 0.276, which applies to both males and females. Multiple global tissue measures account for around double the variance in g in older participants, relative to those in middle age. Finally, we find that associations with intelligence were strongest in frontal, insula, anterior and medial temporal, lateral occipital and paracingulate cortices, alongside subcortical volumes (especially the thalamus) and the microstructure of the thalamic radiations, association pathways and forceps minor.”
…
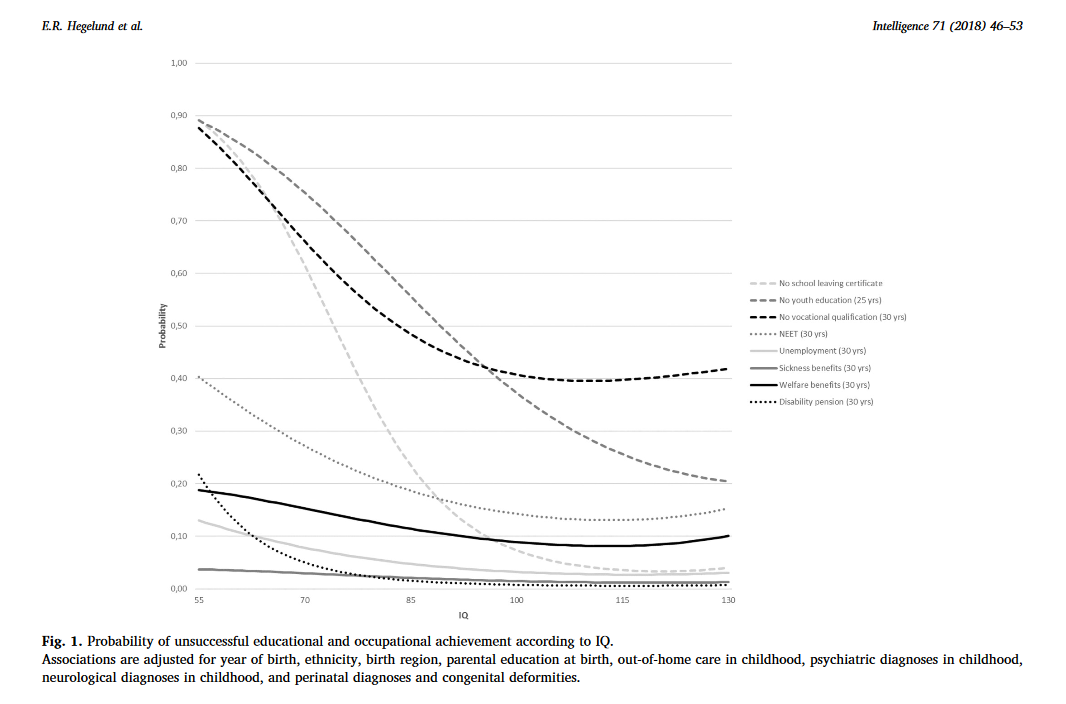
vii. Another IQ study: Low IQ as a predictor of unsuccessful educational and occupational achievement: A register-based study of 1,098,742 men in Denmark 1968–2016.
“Intelligence test score is a well-established predictor of educational and occupational achievement worldwide […]. Longitudinal studies typically report cor-relation coefficients of 0.5–0.6 between intelligence and educational achievement as assessed by educational level or school grades […], correlation coefficients of 0.4–0.5 between intelligence and occupational level […] and cor-relation coefficients of 0.2–0.4 between intelligence and income […]. Although the above-mentioned associations are well-established, low intelligence still seems to be an overlooked problem among young people struggling to complete an education or gain a foothold in the labour market […] Due to contextual differences with regard to educational system and flexibility and security on the labour market as well as educational and labour market policies, the role of intelligence in predicting unsuccessful educational and occupational courses may vary among countries. As Denmark has free admittance to education at all levels, state financed student grants for all students, and a relatively high support of students with special educational needs, intelligence might be expected to play a larger role – as socioeconomic factors might be of less importance – with regard to educational and occupational achievement compared with countries outside Scandinavia. The aim of this study was therefore to investigate the role of IQ in predicting a wide range of indicators of unsuccessful educational and occupational achievement among young people born across five decades in Denmark.”
“Individuals who differed in IQ score were found to differ with regard to all indicators of unsuccessful educational and occupational achievement such that low IQ was associated with a higher proportion of unsuccessful educational and occupational achievement. For example, among the 12.1% of our study population who left lower secondary school without receiving a certificate, 39.7% had an IQ < 80 and 23.1% had an IQ of 80–89, although these individuals only accounted for 7.8% and 13.1% of the total study population. The main analyses showed that IQ was inversely associated with all indicators of unsuccessful educational and occupational achievement in young adulthood after adjustment for covariates […] With regard to unsuccessful educational achievement, […] the probabilities of no school leaving certificate, no youth education at age 25, and no vocational qualification at age 30 decreased with increasing IQ in a cubic relation, suggesting essentially no or only weak associations at superior IQ levels. IQ had the strongest influence on the probability of no school leaving certificate. Although the probabilities of the three outcome indicators were almost the same among individuals with extremely low IQ, the probability of no school leaving certificate approached zero among individuals with an IQ of 100 or above whereas the probabilities of no youth education at age 25 and no vocational qualification at age 30 remained notably higher. […] individuals with an IQ of 70 had a median gross income of 301,347 DKK, individuals with an IQ of 100 had a median gross income of 331,854, and individuals with an IQ of 130 had a median gross income of 363,089 DKK – in the beginning of June 2018 corresponding to about 47,856 USD, 52,701 USD, and 57,662 USD, respectively. […] The results showed that among individuals undergoing education, low IQ was associated with a higher hazard rate of passing to employment, unemployment, sickness benefits receipt and welfare benefits receipt […]. This indicates that individuals with low IQ tend to leave the educational system to find employment at a younger age than individuals with high IQ, but that this early leave from the educational system often is associated with a transition into unemployment, sickness benefits receipt and welfare benefits receipt.”
“Conclusions
This study of 1,098,742 Danish men followed in national registers from 1968 to 2016 found that low IQ was a strong and consistent predictor of 10 indicators of unsuccessful educational and occupational achievement in young adulthood. Overall, it seemed that IQ had the strongest influence on the risk of unsuccessful educational achievement and on the risk of disability pension, and that the influence of IQ on educational achievement was strongest in the early educational career and decreased over time. At the community level our findings suggest that intelligence should be considered when planning interventions to reduce the rates of early school leaving and the unemployment rates and at the individual level our findings suggest that assessment of intelligence may provide crucial information for the counselling of poor-functioning schoolchildren and adolescents with regard to both the immediate educational goals and the more distant work-related future.”
Stuff/Links/Open Thread
“This report shows trends and group differences in current marital status, with a focus on first marriages among women and men aged 15–44 years in the United States. Trends and group differences in the timing and duration of first marriages are also discussed. […] The analyses presented in this report are based on a nationally representative sample of 12,279 women and 10,403 men aged 15–44 years in the household population of the United States.”
“In 2006–2010, […] median age at first marriage was 25.8 for women and 28.3 for men.”
“Among women, 68% of unions formed in 1997–2001 began as a cohabitation rather than as a marriage (8). If entry into any type of union, marriage or cohabitation, is taken into account, then the timing of a first union occurs at roughly the same point in the life course as marriage did in the past (9). Given the place of cohabitation in contemporary union formation, descriptions of marital behavior, particularly those concerning trends over time, are more complete when cohabitation is also measured. […] Trends in the current marital statuses of women using the 1982, 1995, 2002, and 2006–2010 NSFG indicate that the percentage of women who were currently in a first marriage decreased over the past several decades, from 44% in 1982 to 36% in 2006–2010 […]. At the same time, the percentage of women who were currently cohabiting increased steadily from 3.0% in 1982 to 11% in 2006– 2010. In addition, the proportion of women aged 15–44 who were never married at the time of interview increased from 34% in 1982 to 38% in 2006–2010.”
“In 2006–2010, the probability of first marriage by age 25 was 44% for women compared with 59% in 1995, a decrease of 25%. By age 35, the probability of first marriage was 84% in 1995 compared with 78% in 2006–2010 […] By age 40, the difference in the probability of age at first marriage for women was not significant between 1995 (86%) and 2006–2010 (84%). These findings suggest that between 1995 and 2006– 2010, women married for the first time at older ages; however, this delay was not apparent by age 40.”
“In 2006–2010, the probability of a first marriage lasting at least 10 years was 68% for women and 70% for men. Looking at 20 years, the probability that the first marriages of women and men will survive was 52% for women and 56% for men in 2006–2010. These levels are virtually identical to estimates based on vital statistics from the early 1970s (24). For women, there was no significant change in the probability of a first marriage lasting 20 years between the 1995 NSFG (50%) and the 2006–2010 NSFG (52%)”
“Women who had no births when they married for the first time had a higher probability of their marriage surviving 20 years (56%) compared with women who had one or more births at the time of first marriage (33%). […] Looking at spousal characteristics, women whose first husbands had been previously married (38%) had a lower probability of their first marriage lasting 20 years compared with women whose first husband had never been married before (54%). Women whose first husband had children from previous relationships had a lower probability that their first marriage would last 20 years (37%) compared with first husbands who had no other children (54%). For men, […] patterns of first marriage survival […] are similar to those shown for women for marriages that survived up to 15 years.”
“These data show trends that are consistent with broad demographic changes in the American family that have occurred in the United States over the last several decades. One such trend is an increase in the time spent unmarried among women and men. For women, there was a continued decrease in the percentage currently married for the first time — and an increase in the percent currently cohabiting — in 2006–2010 compared with earlier years. For men, there was also an increase in the percentage unmarried and in the percentage currently cohabiting between 2002 and 2006–2010. Another trend is an increase in the age at first marriage for women and men, with men continuing to marry for the first time at older ages than women. […] Previous research suggests that women with more education and better economic prospects are more likely to delay first marriage to older ages, but are ultimately more likely to become married and to stay married […]. Data from the 2006–2010 NSFG support these findings”
…
ii. Involuntary Celibacy: A life course analysis (review). This is not a link to the actual paper – the paper is not freely available, which is why I do not link to it – but rather a link to a report talking about what’s in that paper. However I found some of the stuff interesting:
“A member of an on-line discussion group for involuntary celibates approached the first author of the paper via email to ask about research on involuntary celibacy. It soon became apparent that little had been done, and so the discussion group volunteered to be interviewed and a research team was put together. An initial questionnaire was mailed to 35 group members, and they got a return rate of 85%. They later posted it to a web page so that other potential respondents had access to it. Eventually 60 men and 22 women took the survey.”
“Most were between the ages of 25-34, 28% were married or living with a partner, 89% had attended or completed college. Professionals (45%) and students (16%) were the two largest groups. 85% of the sample was white, 89% were heterosexual. 70% lived in the U.S. and the rest primarily in Western Europe, Canada and Australia. […] the value of this research lies in the rich descriptive data obtained about the lives of involuntary celibates, a group about which little is known. […] The questionnaire contained 13 categorical, close-ended questions assessing demographic data such as age, sex, marital status, living arrangement, income, education, employment type, area of residence, race/ethnicity, sexual orientation, religious preference, political views, and time spent on the computer. 58 open-ended questions investigated such areas as past sexual experiences, current relationships, initiating relationships, sexuality and celibacy, nonsexual relationships and the consequences of celibacy. They started out by asking about childhood experiences, progressed to questions about teen and early adult years and finished with questions about current status and the effects of celibacy.”
“78% of this sample had discussed sex with friends, 84% had masturbated as teens. The virgins and singles, however, differed from national averages in their dating and sexual experiences.”
“91% of virgins and 52 % of singles had never dated as teenagers. Males reported hesitancy in initiating dates, and females reporting a lack of invitations by males. For those who did date, their experiences tended to be very limited. Only 29% of virgins reported first sexual experiences that involved other people, and they frequently reported no sexual activity at all except for masturbation. Singles were more likely than virgins to have had an initial sexual experience that involved other people (76%), but they tended to report that they were dissatisfied with the experience. […] While most of the sample had discussed sex with friends and masturbated as teens, most virgins and singles did not date. […] Virgins and singles may have missed important transitions, and as they got older, their trajectories began to differ from those of their age peers. Patterns of sexuality in young adulthood are significantly related to dating, steady dating and sexual experience in adolescence. It is rare for a teenager to initiate sexual activity outside of a dating relationship. While virginity and lack of experience are fairly common in teenagers and young adults, by the time these respondents reached their mid-twenties, they reported feeling left behind by age peers. […] Even for the heterosexuals in the study, it appears that lack of dating and sexual experimentation in the teen years may be precursors to problems in adult sexual relationships.”
“Many of the virgins reported that becoming celibate involved a lack of sexual and interpersonal experience at several different transition points in adolescence and young adulthood. They never or rarely dated, had little experience with interpersonal sexual activity, and had never had sexual intercourse. […] In contrast, partnered celibates generally became sexually inactive by a very different process. All had initially been sexually active with their partners, but at some point stopped. At the time of the survey, sexual intimacy no longer or very rarely occurred in their relationships. The majority of them (70%) started out having satisfactory relationships, but they slowly stopped having sex as time went on.”
“shyness was a barrier to developing and maintaining relationships for many of the respondents. Virgins (94%) and singles (84%) were more likely to report shyness than were partnered respondents (20%). The men (89%) were more likely to report being shy than women (77%). 41% of virgins and 23% of singles reported an inability to relate to others socially. […] 1/3 of the respondents thought their weight, appearance, or physical characteristics were obstacles to attracting potential partners. 47% of virgins and 56% of singles mentioned these factors, compared to only 9% of partnered people. […] Many felt that their sexual development had somehow stalled in an earlier stage of life; feeling different from their peers and feeling like they will never catch up. […] All respondents perceived their lack of sexual activity in a negative light and in all likelihood, the relationship between involuntary celibacy and unhappiness, anger and depression is reciprocal, with involuntary celibacy contributing to negative feelings, but these negative feelings also causing people to feel less self-confident and less open to sexual opportunities when they occur. The longer the duration of the celibacy, the more likely our respondents were to view it as a permanent way of life. Virginal celibates tended to see their condition as temporary for the most part, but the older they were, the more likely they were to see it as permanent, and the same was true for single celibates.”
It seems to me from ‘a brief look around’ that not a lot of research has been done on this topic, which I find annoying. Because yes, I’m well aware these are old data and that the sample is small and ‘convenient’. Here’s a brief related study on the ‘Characteristics of adult women who abstain from sexual intercourse‘ – the main findings:
“Of the 1801 respondents, 244 (14%) reported abstaining from intercourse in the past 6 months. Univariate analysis revealed that abstinent women were less likely than sexually active women to have used illicit drugs [odds ratio (OR) 0.47; 95% CI 0.35–0.63], to have been physically abused (OR 0.44, 95% CI 0.31–0.64), to be current smokers (OR 0.59, 95% CI 0.45–0.78), to drink above risk thresholds (OR 0.66, 95% CI 0.49–0.90), to have high Mental Health Inventory-5 scores (OR 0.7, 95% CI 0.54–0.92) and to have health insurance (OR 0.74, 95% CI 0.56–0.98). Abstinent women were more likely to be aged over 30 years (OR 1.98, 95% CI 1.51–2.61) and to have a high school education (OR 1.38, 95% CI 1.01–1.89). Logistic regression showed that age >30 years, absence of illicit drug use, absence of physical abuse and lack of health insurance were independently associated with sexual abstinence.
Conclusions
Prolonged sexual abstinence was not uncommon among adult women. Periodic, voluntary sexual abstinence was associated with positive health behaviours, implying that abstinence was not a random event. Future studies should address whether abstinence has a causal role in promoting healthy behaviours or whether women with a healthy lifestyle are more likely to choose abstinence.”
Here’s another more recent study – Prevalence and Predictors of Sexual Inexperience in Adulthood (unfortunately I haven’t been able to locate a non-gated link) – which I found and may have a closer look at later. A few quotes/observations:
“By adulthood, sexual activity is nearly universal: 97 % of men and 98 % of women between the ages of 25-44 report having had vaginal intercourse (Mosher, Chandra, & Jones, 2005). […] Although the majority of individuals experience this transition during adolescence or early adulthood, a small minority remain sexually inexperienced far longer. Data from the NSFG indicate that about 5% of males and 3% of females between the ages of 25 and 29 report never having had vaginal sex (Mosher et al., 2005). While the percentage of sexually inexperienced participants drops slightly among older age groups, between 1 and 2% of both males and females continue to report that they have never had vaginal sex even into their early 40s. Other nationally representative surveys have yielded similar estimates of adult sexual inexperience (Billy, Tanfer, Grady, & Klepinger, 1993)”
“Individuals who have not experienced any type of sexual activity as adults […] may differ from those who only abstain from vaginal intercourse. For example, vaginal virgins who engage in “everything but” vaginal sex – sometimes referred to as “technical virgins” […] – may abstain from vaginal sex in order to avoid its potential negative consequences […]. In contrast, individuals who have neither coital nor noncoital experience may have been unable to attract sexual partners or may have little interest in sexual involvement. Because prior analyses have generally conflated these two populations, we know virtually nothing about the prevalence or characteristics of young adults who have abstained from all types of sexual activity.”
“We used data from 2,857 individuals who participated in Waves I–IV of the National Longitudinal Study of Adolescent Health (Add Health) and reported no sexual activity (i.e., oral-genital, vaginal, or anal sex) by age 18 to identify, using discrete-time survival models, adolescent sociodemographic, biosocial, and behavioral characteristics that predicted adult sexual inexperience. The mean age of participants at Wave IV was 28.5 years (SD = 1.92). Over one out of eight participants who did not initiate sexual activity during adolescence remained abstinent as young adults. Sexual non-attraction significantly predicted sexual inexperience among both males (aOR = 0.5) and females (aOR = 0.6). Males also had lower odds of initiating sexual activity after age 18 if they were non-Hispanic Asian, reported later than average pubertal development, or were rated as physically unattractive (aORs = 0.6–0.7). Females who were overweight, had lower cognitive performance, or reported frequent religious attendance had lower odds of sexual experience (aORs = 0.7–0.8) while those who were rated by the interviewers as very attractive or whose parents had lower educational attainment had higher odds of sexual experience (aORs = 1.4–1.8). Our findings underscore the heterogeneity of this unique population and suggest that there are a number of different pathways that may lead to either voluntary or involuntary adult sexual inexperience.”
…
“Breastfeeding has clear short-term benefits, but its long-term consequences on human capital are yet to be established. We aimed to assess whether breastfeeding duration was associated with intelligence quotient (IQ), years of schooling, and income at the age of 30 years, in a setting where no strong social patterning of breastfeeding exists. […] A prospective, population-based birth cohort study of neonates was launched in 1982 in Pelotas, Brazil. Information about breastfeeding was recorded in early childhood. At 30 years of age, we studied the IQ (Wechsler Adult Intelligence Scale, 3rd version), educational attainment, and income of the participants. For the analyses, we used multiple linear regression with adjustment for ten confounding variables and the G-formula. […] From June 4, 2012, to Feb 28, 2013, of the 5914 neonates enrolled, information about IQ and breastfeeding duration was available for 3493 participants. In the crude and adjusted analyses, the durations of total breastfeeding and predominant breastfeeding (breastfeeding as the main form of nutrition with some other foods) were positively associated with IQ, educational attainment, and income. We identified dose-response associations with breastfeeding duration for IQ and educational attainment. In the confounder-adjusted analysis, participants who were breastfed for 12 months or more had higher IQ scores (difference of 3,76 points, 95% CI 2,20–5,33), more years of education (0,91 years, 0,42–1,40), and higher monthly incomes (341,0 Brazilian reals, 93,8–588,3) than did those who were breastfed for less than 1 month. The results of our mediation analysis suggested that IQ was responsible for 72% of the effect on income.”
This is a huge effect size.
…
iv. Grandmaster blunders (chess). This is quite a nice little collection; some of the best players in the world have actually played some really terrible moves over the years, which I find oddly comforting in a way..
…
v. History of the United Kingdom during World War I (wikipedia, ‘good article’). A few observations from the article:
“In 1915, the Ministry of Munitions under David Lloyd-George was formed to control munitions production and had considerable success.[113][114] By April 1915, just two million rounds of shells had been sent to France; by the end of the war the figure had reached 187 million,[115] and a year’s worth of pre-war production of light munitions could be completed in just four days by 1918.”
“During the war, average calories intake [in Britain] decreased only three percent, but protein intake six percent.[47]“
“Energy was a critical factor for the British war effort. Most of the energy supplies came from coal mines in Britain, where the issue was labour supply. Critical however was the flow of oil for ships, lorries and industrial use. There were no oil wells in Britain so everything was imported. The U.S. pumped two-thirds of the world’s oil. In 1917, total British consumption was 827 million barrels, of which 85 percent was supplied by the United States, and 6 percent by Mexico.”
“In the post war publication Statistics of the Military Effort of the British Empire During the Great War 1914–1920 (The War Office, March 1922), the official report lists 908,371 ‘soldiers’ as being either killed in action, dying of wounds, dying as prisoners of war or missing in action in the World War. (This is broken down into the United Kingdom and its colonies 704,121; British India 64,449; Canada 56,639; Australia 59,330; New Zealand 16,711; South Africa 7,121.) […] The civilian death rate exceeded the prewar level by 292,000, which included 109,000 deaths due to food shortages and 183,577 from Spanish Flu.”
…
vi. House of Plantagenet (wikipedia, ‘good article’).
…
vii. r/Earthp*rn. There are some really nice pictures here…
Intelligence – a very short introduction
I figured that as I was already spending time reading stuff on related matters, I might as well cover this topic as well (intelligence is not a personality variable they spend many paragraphs discussing in the Handbook) – but given that I’m not that interested in this stuff, I also figured I didn’t want to spend too much time on it. So reading a book with the subtitle ‘a very short introduction’ made sense.
The book is not very technical, and I was seriously considering as I was reading the first few pages to just throw it away. But I decided that I’d give it a few more pages, and having done that I realized that even though the coverage was somewhat superficial I might as well finish it as it would take very little effort. From the outset I sort of expected the book to be a ‘downgraded’ version of a standard Springer publication. It turned out that it was not, the level was significantly lower than that – either that or my conceptualization of how such a ‘downgraded’ (‘more accessible!’) book looks like was erroneous. Either way I was somewhat disappointed. I ended up giving the book two stars on goodreads. There was too much fluff and he spent a lot of time dealing with simple stuff.
Some of the conceptual and methodological approaches applied in this line of research are also applied in other areas of psychologic research covered in Leary & Hoyle, but you certainly don’t need to have read anything about psychology, psychometrics etc. in order to read and understand this book. To give an example of what I mean by the first part, in various areas of personality research it’s common for researchers to in some sense look for ‘common factors’ that tend to cluster together – the existence of such common factors relate very closely to the existence of such a thing as personality traits in the first place. The idea is that people who are in some sense ‘alike’ along one ‘dimension’ of personality/behaviours are likely to also be ‘alike’ along ‘similar’ related ‘dimensions’, and once you add the various elements in such clusters together and construct new variables and use these to have a closer look at stuff you might be interested in, these constructs can be used to gain a better understanding of behavioural links, because they tend to predict behaviour better than do the elements they’re made up of. You can add stuff together at more than one level if you like. The search for ‘g’ in the area of intelligence research is in some sense just a hunt for such a ‘common factor’; a factor useful in explaining variation in peoples’ performances at various cognitive tasks. The important point here being that most intelligence researchers agree that it makes sense to look for such a common factor, because it looks a lot as if such a factor exists in the data. A bit from the first chapter of the book about this stuff:
“Carroll’s strata of mental abilities emerged as an optimal result from a standardized statistical procedure, not from his imposing a structure on the data. He discovered rather than invented the hierarchy of intelligence differences […] Among psychologists working in this field there is no longer any substantial debate about the structure of human mental ability differences. Something like John Carroll’s three-stratum model almost always appears from a collection of mental tests. A general factor emerges that accounts for about half of the individual differences among the scores for a group of people, and there are group factors that are narrower abilities, and then very specific factors below that. Therefore, we can nowadays describe the structure of mental test performances quite reliably […]
The principal dissidents from this well-supported view are on the semi-popular fringes of scientific psychology. Howard Gardner’s popular writings on ‘multiple intelligences’ have suggested that there are many forms of mental ability and that they are unrelated. The facts are that some of Gardner’s supposedly separate intelligences are well known to be correlated positively and linked thereby to general mental ability, such as his verbal, mathematical, and musical intelligences. Some of his so-called intelligences, though valued human attributes, are not normally considered to be mental abilities, i.e. not within man’s ‘cognitive’ sphere. For example, physical intelligence is a set of motor skills and interpersonal intelligence involves personality traits.”
Here’s a little bit about ageing from the book (in the chapter he also talks a bit about the distinction between crystallized and fluid intelligence, among other things):
“what ages when we talk of intelligence ageing is something very general – some broad capability of the brain to handle ideas is changing, not just specific aspects of mental function […] what seems like a kaleidoscope of mental change can to a great extent be explained by one simple fact: as we get older our rate of processing information in the brain slows down.”
And below a few observations from chapter 3:
“there is a modest positive correlation between head size and brain size […] There is a modest association between brain size and psychometric intelligence. People with bigger brains tend to have higher mental test scores.” […]
“Psychologists today often refer to the ‘mental speed’ or ‘information processing speed’ ‘theory’ of intelligence. What they mean by that is that people who score better on intelligence tests might in part be cleverer because some key aspect(s) of the brain proceeds faster. My principal problem with this overall idea is that my colleagues can’t make up their mind how to measure this mental speed. Some use reaction times. Some use inspection times. Some use the brain’s electrical responses. Some even measure how long it takes electrical impulses to travel along people’s nerves. But these are all different measures, and it is an odd theory that can be tested without a common yardstick, and some of these mental speed ‘yardsticks’ don’t relate to each other very well at all. The truth is that we do not have an agreed measure of how fast the brain processes information, and that is because the workings of the nerve cells and their networks are largely mysterious. We must summarize by concluding, therefore, that intelligence is related to many things that involve speed of processing information, but that scientists have difficulty in conceptualizing ‘mental speed’ in a uniform way.”
I don’t really think it’s worth the trouble to cover more of the book in detail here, as a lot of the stuff covered in the book has already been covered here on the blog before – instead of reading the book you can just have a look at some of the stuff I’ve posted on intelligence before here – links like these: 1 (link vi.), 2, 3, 4, and 5 (not all of the stuff at the links is covered in the book, but I can’t be bothered to find all the matching papers and if you read the links in those posts you’ll probably learn more than you will from reading the book).
Stuff
File under: Stuff you probably didn’t know about that actually matters a great deal.
“Generation of electricity using coal started at the end of the 19th century. The first power stations had an efficiency of around 1%, and needed 12.3 kg of coal for the generation of 1 kWh. […] With increasing experience, in combination with research and development, these low efficiency levels improved rapidly. Increased technical experience with coal processing and combustion technology enabled a steady increase in the steam parameters ‘pressure’ and ‘temperature’, resulting in higher efficiency. In the years 1910, efficiency had already increased to 5%, reaching 20% by 1920. In the fifty’s, power plants achieved 30% efficiency, but the average efficiency of all operating power plants was still a modest 17%. […] continuous development resulted around the mid 80’s in an average efficiency of 38% for all power stations, and best values of 43%. In the second half of the nineties, a Danish power plant set a world record at 47%. […] The average efficiency of all coal power stations in the world is around 31%. […] In the next 10 years [the paper is from 2005, US], efficiencies up to 55% can be expected.” […]
Often, the question is asked why the ‘other 45%’ cannot be converted into electricity. This relates to the laws of physics: the absolute maximum efficiency is the so-called ‘Carnot efficiency‘. For a turbine operating with gasses of 600°C, it is 67%. Then we need to take into account the exergy content of steam (around 94%). Also combustion has an efficiency less than 100% (around 95%). The transfer of combustion heat to steam in the boiler is for example 96% efficient. Losses due to friction can be around 5% (efficiency 95%). The efficiency of a generator is about 98% on average . . . .
To obtain the combined efficiency, one needs to multiply the efficiency of each process. Taking the above mentioned components, one obtains 0.67 x 0.94 x 0.95 x 0.96 x 0.95 x 0.98 = 0.535 or 53.5%.
This does not yet take into account the efficiency of all components. The power station’s own power use for motors to grind coal, pumps, ventilators, . . . further reduces efficiency. In practice, net efficiency will be around 40 and 45%. Continuous load changes, i.e. following the load, and start-up/shutdown procedures further lower efficiency. The increasing variability of the load, through increased use of intermittent sources such as wind, will lead to increased swings in the load of the power station, reducing efficiency.”
…
ii. Allostatic load as a marker of cumulative biological risk: MacArthur studies of successful aging. From the abstract:
“Allostatic load (AL) has been proposed as a new conceptualization of cumulative biological burden exacted on the body through attempts to adapt to life’s demands. Using a multisystem summary measure of AL, we evaluated its capacity to predict four categories of health outcomes, 7 years after a baseline survey of 1,189 men and women age 70–79. Higher baseline AL scores were associated with significantly increased risk for 7-year mortality as well as declines in cognitive and physical functioning and were marginally associated with incident cardiovascular disease events, independent of standard socio-demographic characteristics and baseline health status. The summary AL measure was based on 10 parameters of biological functioning, four of which are primary mediators in the cascade from perceived challenges to downstream health outcomes. Six of the components are secondary mediators reflecting primarily components of the metabolic syndrome (syndrome X). AL was a better predictor of mortality and decline in physical functioning than either the syndrome X or primary mediator components alone. The findings support the concept of AL as a measure of cumulative biological burden.
In elderly populations, comorbidity in the form of multiple co-occurring chronic conditions is the norm rather than the exception. For example, in the U.S. 61% of women and 47% of men age 70–79 report two or more chronic conditions. These figures rise to 70% of women and 53% of men age 80–89 with 2+ chronic conditions (1). No single form of comorbidity occurs with high frequency, but rather a multiplicity of diverse combinations are observed (e.g., osteoarthritis and diabetes, colon cancer, coronary heart disease, depression, and hypertension). This diversity underscores the need for an early warning system of biomarkers that can signal early signs of dysregulation across multiple physiological systems.
One response to this challenge was the introduction of the concept of allostatic load (AL) (2–4) as a measure of the cumulative physiological burden exacted on the body through attempts to adapt to life’s demands. The ability to successfully adapt to challenges has been referred to by Sterling and Eyer (5) as allostasis. This notion emphasizes the physiological imperative that, to survive, “an organism must vary parameters of its internal milieu and match them appropriately to environmental demands” (5). When the adaptive responses to challenge lie chronically outside of normal operating ranges, wear and tear on regulatory systems occurs and AL accumulates.”
They conclude that: “The analyses completed to date suggest that the concept of AL offers considerable insight into the cumulative risks to health from biological dysregulation across multiple regulatory systems.” I haven’t come across the concept before but I’ll try to keep it in mind. There’s a lot of stuff on this.
…
iii. Surviving a plane crash is surprisingly common.
“a few years ago, I learned that it’s actually pretty common to survive a plane crash. Like most people, I’d assumed that the safety in flying came from how seldom accidents happened. Once you were in a crash situation, though, I figured you were probably screwed. But that’s not the case.
Looking at all the commercial airline accidents between 1983 and 2000, the National Transportation Safety Board found that 95.7% of the people involved survived. Even when they narrowed down to look at only the worst accidents, the overall survival rate was 76.6%. Yes, some plane crashes kill everyone on board. But those aren’t the norm. So you’re even safer than you think. Not only are crashes incredibly rare, you’re more likely to survive a crash than not. In fact, out of 568 accidents during those 17 years, only 71 resulted in any fatalities at all.”
…
iv. Now that we’re talking about planes: What does an airplane actually cost? Here’s one article on the subject:
“As for actual prices, airlines occasionally let numbers slip, either because of disclosure requirements or loose tongues.
Southwest Airlines Co., LUV +0.11% for example, recently published numbers related to its new order for Boeing 737 Max jetliners in a government filing. Mr. Liebowitz of Wells Fargo crunched the data and estimated an actual base price of roughly $35 million per plane, or a discount of around 64%. He noted that Southwest is one of Boeing’s best customers and that early buyers of new models get preferential pricing. A Southwest spokeswoman declined to comment.
Air India, in seeking funding last year for seven Boeing 787 Dreamliners it expects to receive this year, cited an average “net cost” of about $110 million per plane. The current list price is roughly $194 million, suggesting a 43% discount. Air India didn’t respond to a request for comment for this article.
In March 2011, Russian flag carrier Aeroflot mentioned in a securities filing that it would pay at most $1.16 billion for eight Boeing 777s…”
100+ million dollars for a plane. I had not seen that one coming. File under: Questions people don’t seem to be asking, which I think is sort of weird. Now that we’re at it, what about trains? Here’s a Danish article about our new IC4-trains. A conservative estimate is at $1,09 billion (6,4 billion kroner) for 83 trains, which is ~$13,2 million/train (or rather per trainset (US terminology) or ~77 million Danish kroner. That’s much cheaper than the big airplanes, but it sure is a lot of money. What about busses? I’ve often thought about this one, perhaps because it’s a mode of transportation I use far more frequently than the others. Here’s one bit of information about the situation in the US, which is surely different from the Danish one but not that different:
“Diesel buses are the most common type of bus in the United States, and they cost around $300,000 per vehicle, although a recent purchase by the Chicago Transit Authority found them paying almost $600,000 per diesel bus. Buses powered by natural gas are becoming more popular, and they cost about $30,000 more per bus than diesels do. Los Angeles Metro recently spent $400,000 per standard size bus and $670,000 per 45 foot bus that run on natural gas.
Hybrid buses, which combine a gasoline or diesel engine with an electric motor much like a Toyota Prius, are much more expensive than either natural gas or diesel buses. Typically, they cost around $500,000 per bus with Greensboro, NC’s transit system spending $714,000 per vehicle.”
So of course you can’t actually compare these things this way because of the different way costs are calculated, but let’s just for fun assume you can: When you use the average price of a standard US diesel bus and compare it to the price of the recently bought Danish trains, the conclusion is that you could buy 44 busses for the price of one train. And you could buy 367 busses for the price of one of the Dreamliners.
…
v. A new blog you might like: Collectively Unconscious. A sort of ‘The Onion’ type science-blog.
…
vi. I was considering including this stuff in a wikipedia-post, but I thought I’d include it here instead because what’s interesting is not the articles themselves but rather their differences: Try to compare this english language article, about a flame tank designed in the United States, with this article about the same tank but written in Russian. I thought ‘this is weird’ – anybody have a good explanation for this state of affairs?
…
vii. The Emergence and Representation of Knowledge about Social and Nonsocial Hierarchies. I haven’t found an ungated version of the paper, but here’s the summary:
“Primates are remarkably adept at ranking each other within social hierarchies, a capacity that is critical to successful group living. Surprisingly little, however, is understood about the neurobiology underlying this quintessential aspect of primate cognition. In our experiment, participants first acquired knowledge about a social and a nonsocial hierarchy and then used this information to guide investment decisions. We found that neural activity in the amygdala tracked the development of knowledge about a social, but not a nonsocial, hierarchy. Further, structural variations in amygdala gray matter volume accounted for interindividual differences in social transitivity performance. Finally, the amygdala expressed a neural signal selectively coding for social rank, whose robustness predicted the influence of rank on participants’ investment decisions. In contrast, we observed that the linear structure of both social and nonsocial hierarchies was represented at a neural level in the hippocampus. Our study implicates the amygdala in the emergence and representation of knowledge about social hierarchies and distinguishes the domain-general contribution of the hippocampus.”
…
viii.
I’ve only actually watched the first 15 minutes (and I’m not sure I’ll watch the rest), but I assume some of you will find this interesting.
Stuff
i. Contradictory Messages: A Content Analysis of Hollywood-Produced Romantic Comedy Feature Films.
“This study analyzed the romantic content of a sample of 40 romantic comedy films using a basic grounded theory methodology. Analyses revealed that such films appear to depict romantic relationships as having qualities of both new and long-term relationships; that is, to be both novel and exciting, yet emotionally significant and meaningful. Furthermore, relationships were shown to have both highly idealistic and undesirable qualities but, for any problems or transgressions experienced to have no real negative long-term impact on relationship functioning. The potential for viewer interpretations is discussed and the need for future research highlighted. […]
Of the 107 [romantic] gestures coded, male characters performed 90, they gave 35 of 37 gifts, performed 14 of 17 favors, and took more steps to initiate relationships (63 of 84). Such a proportion of effort could lead to the distinguishing of gender roles, identifying the man’s role to ‘‘take the lead’’ when it comes to relationships. A further implication could be female adolescent viewers’ forming of somewhat idealized relationship expectations. With films depicting male characters as frequently performing exaggeratedly romantic gestures […], female adolescents may be led to believe that such behaviors are the norm. Furthermore, by preferring to focus on behaviors between couples such as the aforementioned, it is possible that such films may make these gestures more salient to adolescents as an indication of the extent of partners’ feelings for them and the quality of the relationship itself over factors such as communication and trust.
Although there were 61 coded instances of ‘‘open about feelings and intentions,’’ there were only 4 incidents coded pertaining to trust, with 3 of these demonstrating a character’s lack of trust in their partner. […] The lack of depiction of trust becomes particularly notable when looking at the number of incidents of ‘‘deception’’ coded. There were 82 such incidents, occurring across all 40 films, ranging from white lies so as to spare partners’ feelings, to more serious acts of deception such as ulterior motives and direct lying for personal gains. These far outweighed characters confessing their lies and deceptive acts to their partners (9), with lies being discovered by partners typically by chance or indeed not at all. […]
Another category to emerge at this stage of coding that may have the potential to influence viewer perceptions was ‘‘being single.’’ Although this was one of the smaller categories, each coded incident (15) was consistently negative. Individuals who were single were depicted as either lonely and miserable […], frustrated […], or made to feel insecure […]. Two films […] even suggested that being single might interfere with career progression. Such a consistently negative representation of being single could, therefore, have the potential to negatively influence viewers’ feelings toward being single themselves. […]
It should be further noted that of the incidents of affection coded, a vast minority occurred between married couples. Married couples were typically portrayed as either unhappy with their spouse […], or were implied as happy but did little to reflect this […]. Of the depictions of affection between married couples that were coded, many were interspersed with episodes of arguing […], and most were limited to gestures such as brief kisses or standing with an arm around one other. Such a representation of marriage may leave adolescent viewers to see marriage and romance as disparate entities and with affection between married couples as an exception instead of the norm. […]
What is interesting to note about the behaviors comprising this category [‘relationship issues’], however, is that, irrespective of seriousness, there appeared to be no real consequences for characters’ transgressions in their relationships. […] Such depictions do not accurately reflect the actual emotions individuals typically experience in response to acts of deception and betrayal in their relationships, which can involve feelings of hurt, anger, resentment, and relational devaluation (Fitness, 2001). As a result, with characters’ negative behaviors either going undiscovered or having no long-lasting impact on their relationships, adolescent viewers may underestimate the consequences their behaviors can have on their own relationships.”
…
ii. The burden of knowledge and the ‘death of the renaissance man’: Is innovation getting harder? by Benjamin Jones.
“This paper investigates, theoretically and empirically, a possibly fundamental aspect of technological progress. If knowledge accumulates as technology progresses, then successive generations of innovators may face an increasing educational burden. Innovators can compensate in their education by seeking narrower expertise, but narrowing expertise will reduce their individual capacities, with implications for the organization of innovative activity – a greater reliance on teamwork – and negative implications for growth. I develop a formal model of this “knowledge burden mechanism” and derive six testable predictions for innovators. Over time, educational attainment will rise while increased specialization and teamwork follow from a sufficiently rapid increase in the burden of knowledge. In cross-section, the model predicts that specialization and teamwork will be greater in deeper areas of knowledge while, surprisingly, educational attainment will not vary across fields. I test these six predictions using a micro-data set of individual inventors and find evidence consistent with each prediction. The model thus provides a parsimonious explanation for a range of empirical patterns of inventive activity. Upward trends in academic collaboration and lengthening doctorates, which have been noted in other research, can also be explained by the model, as can much-debated trends relating productivity growth and patent output to aggregate inventive effort. The knowledge burden mechanism suggests that the nature of innovation is changing, with negative implications for long-run economic growth.”
…
iii. The Basic Laws of Human Stupidity.
…
iv. Beyond Guns and God, Understanding the Complexities of the White Working Class in America. I haven’t read it and I don’t think I will, but I thought I should put the link up anyway. The link has a lot of data.
…
v. Some Danish church membership numbers. The site is in Danish but google translate is your friend and there isn’t much text anyway. Where I live almost 5 out of 6 people are members of the church. Over the last 20 years the national membership rate has dropped by ~0,5 percentage points/year. 4 out of 5 Danes are members of the national church, in 1990 it was 9 out of 10. Approximately 90% of the people who die are members, whereas ‘only’ approximately 70% of children being born get baptized. Children of non-Western immigrants make up less than 10% of all births (9,1% from 2006-2010) – so even though population replacement may be part of the story, there’s likely other stuff going on as well.
…
vi. Intelligence: Knowns and Unknowns. I may blog this in more detail later, for now I’ll just post the link.
…
vii. Theodore Dalrymple visited North Korea in 1989. The notes here about his visit to Department Store Number 1 are worth reading.
Reaching peak performance?

From this paper – Comparative longitudinal structural analyses of the growth and decline of multiple intellectual abilities over the life span.
On a related if tangential note; I tend to do better on some of the measures included than I do on others. I tend to do well on some of the kinds of measures of intellectual ability – and/or (depending on who you ask..) measures which correlate significantly with intellectual ability – that are relatively easily observable, and I think some people, including some of the readers of this blog, overestimate me for that reason. There are people out there who can calculate the inverses of 2 3×3 matrices, then proceed to calculate the Kronecker product of the matrices and then move on to finally calculate the determinant of the resulting 9×9 matrix in a ridiculously short amount of time, and/or perhaps even without writing anything down along the way. I’m not one of those people and there are a lot of people in between me and them. (Now, you might argue that such an ability is easily observable but the kind of observability I have in mind here is one which relates to the social context.)
Incidentally, I did not blog this back when I originally read it (via MR; Tabarrok posted another graph which sparked a lot of debate) and now’s as good a time as any to post it here:

Here’s another one from the same presentation:

Gordon – Everyday Life as an Intelligence Test
Here’s the link (pdf). Some excerpts:
“this article examines the issue of general intelligence in everyday life, where many tasks tend to be performed widely if not universally. The aim is to elucidate both the practical importance of intelligence within that sphere and some major obstacles to the full recognition of that importance. The effects of such obstacles often exist side by side with a keen, if sometimes reticent, awareness by many individuals of the role of intelligence in its more standard applications, such as schooling and certain occupations. […]
It is often not apparent to persons that cognitive tasks are embedded in many of life’s everyday activities, as those activities (say, parenting) often exhibit other, perhaps more salient, facets of content (warmth) that seem to outweigh any cognitive component (judgment) until the latter comes forcibly to attention (as when a warm parent leaves small children unattended with matches in the house). Empirically, however, such noncognitive facets may individually contribute much less than g does to variance in overall or long-term task performance (child safety) and, especially, to the task-as-item covariance (i.e., what is common to all such tasks) upon which any test depends for its reliability. […]
Underrecognition of the cognitive component is abetted by numerous other features of the phenomenology and organization of intelligence in everyday life. Not least among these is the fact that there certainly are everyday activities in which a cognitive component is thought crucial, but such activities are set somewhat apart by our culture in special categories. The result is that the residual activities may unthinkingly be consigned by laypersons to the noncognitive realm by virtue of the contrast. Education and learning have, of course, been the chief repositories of tasks viewed as essentially cognitive, and it is only in recent times that this view has been broadened among specialists to include performance within jobs and participation in crime.
Although Singaporean mothers were able, when specifically asked, to perceive the role of intelligence in a variety of children’s behaviors, such as “Shows common-sense” and “Sizes up a situation badly,” it was “Learns quickly,” a typically academic marker, that had the highest g loading in a factor analysis of 55 ranked items (Nevo & Khader, 1995). Between first, third, and sixth grades, academic skills increasingly come to dominate children’s attention as examples of what it means to be smart or intelligent (Yussen & Kane, 1985, Tables 2-3). It would appear that social perception of the role of intelligence is drawn toward outcomes with the highest g loadings, which is not surprising, but it may sometimes be tacitly misconcluded as a result that other outcomes have no g loadings at all when their loadings are simply not as high. Just as individuals may often be assigned too hastily to only two categories on the g continuum, say, qualified and unqualified, so may the g-loadedness of outcomes be falsely dichotomized.
A crucial final point is that, as in aggregate data, repetition of a single task or response by multiple persons can produce regularities in percentages and averages that are as reliable in life (and as indicative of the operation of g) as the results of multiple tasks presented to a single person on tests. If two populations differ in the average g that they bring to a repeated single task in everyday life, reliable group differences in average performance will emerge, just as group differences emerge in rates of passing an individual test item. Support for the role of intelligence from aggregate data, when uncovered, thus makes it possible to work backward to the inference that intelligence was very likely an influential component of the individual behavior so aggregated if that was not already an accepted view […]
What I am arguing against here, and hope to overcome with data, is a double standard in agnosticism among many test defenders concerning the potential g-loadedness of items, depending on whether the items appear on tests or in everyday life. […]
Although again deceptively commonplace to test experts, Jensen’s (1986b,p. 109) third provision, that in order to measure individual differences in a group of people, “item difficulty (i.e., percent ‘failing’ the item) must be greater than 0 and less than loo%,” is of profound significance for understanding why the role of g in life tasks tends to be underestimated. Many everyday behaviors, such as operating a car, prove so easy for most persons that they seem not to depend on what the layperson thinks of as intelligence at all, and performing them produces no subjective sense of the effort known as “thinking.” Recall the estimate quoted above that some errors occur as seldom as one in 10,000 opportunities. Many such tasks, of course, were overlearned in childhood, when effort would have been more apparent. Adults who commit inexplicable errors on such tasks are greeted with special epithets, suggestive of no intelligence at all. […]
Research on elementary cognitive tasks (ECTs), although conducted in the laboratory rather than on everyday tasks, provides especially informative examples of performances misperceived as making no demand on intelligence. ECTs are often so easy (pressing the button beside the light that goes on) that virtually no one gets them wrong, and participants cannot tell the difference between their own better and poorer performances (Jensen, 1980a, p. 691). Sensitive monitoring of reaction times (defined as the interval, in milliseconds, between the light signal and release of one’s finger from a home button) reveals, however, that speed of such performances does vary and is reliably correlated with g (Jensen,1993b). Jensen (1980b, p. 109) remarked that the cognitive demands of one particular ECT “are so extremely simple that it seems almost implausible that the procedure could yield any measurements that would be correlated with IQ.” The indefinite linearity of performance with IQ upwards (e.g., Hawk, 1970) appears to apply in the downward direction as well when appropriately measured, to include performance on tasks even as easy as these. […] In test parlance, mundane life lacks sufficient “top” or “ceiling,” that is, lacks items at a sufficiently high level of difficulty to reveal clearly the advantages of high intelligence over average intelligence […]
Almost all research on intelligence has been focused upon the individual level of analysis. For studied outcomes, research usually takes the form of correlating a measure of g with the outcome. For several reasons, some made understandable by the previous discussion of the test analogy, the theoretical value of such correlations is often underestimated. First, behaviors are rarely observed at the lowest level of performance, which would make their dependence on intelligence more apparent, and the correlations more convincing, because society is usually structured to prevent such poor performances from occurring. Second, performance failures, when witnessed, are often attributed to superficial causes, for example, not planning ahead, that are formulated in a manner that conceals the role of intelligence behind noncognitive, often motivational, terminology. Third, modest correlations that do get reported between IQ and outcomes are often dismissed as too inconsequential to motivate theory”
…
From the first 13 pages (of 118). I haven’t read much more than that yet, maybe I’ll post more on this later. Here’s a related paper written around the same time.
A gem
I just found it earlier today. So do I link here, here or perhaps here? I don’t know yet, there’s much to explore and I haven’t spent a lot of time there yet. A longish quote from one of the ‘notes’ (which has more..):
““That is, from January 1926 through December 2002, when holding periods were 19 years or longer, the cumulative real return on stocks was never negative…”
How does one engage in extremely long investments? On a time-scale of centuries, investment is a difficult task, especially if one seeks to avoid erosion of returns by the costs of active management.
‘Unit Investment Trust (UIT) is a US investment company offering a fixed (unmanaged) portfolio of securities having a definite life.’
‘A closed-end fund is a collective investment scheme with a limited number of shares’
In long-term investments, one must become concerned about biases in the data used to make decisions. Many of these biases fall under the general rubric of “observer biases” – the canonical example being that stocks look like excellent investments if you only consider America’s stock market, where returns over long periods have been quite good. For example, if you had invested by tracking the major indices any time period from January 1926 through December 2002 and had held onto your investment for at least 19 years, you were guaranteed a positive real return. Of course, the specification of place (America) and time period (before the Depression and after the Internet bubble) should alert us that this guarantee may not hold elsewhere. Had a long-term investor in the middle of the 19th century decided to invest in a large up-and-coming country with a booming economy and strong military (much like the United States has been for much of the 20th century), they would have reaped excellent returns. That is, until the hyperinflation of the Wiemar Republic. Should their returns have survived the inflation and imposition of a new currency, then the destruction of the 3rd Reich would surely have rendered their shares and Reichmarks worthless. Similarly for another up-and-coming nation – Japan. Mention of Russia need not even be made.
Clearly, diversifying among companies in a sector, or even sectors in a national economy is not enough. Disaster can strike an entire nation. Rosy returns for stocks quietly ignore those bloody years in which exchanges plunged thousands of percent in real terms, and whose records burned in the flames of war. Over a timespan of a century, it is impossible to know whether such destruction will be visited on a given country or even whether it will still exist as a unit. How could Germany, the preeminent power on the Continent, with a burgeoning navy rivaling Britain’s, with the famous Prussian military and Junkers, with an effective industrial economy still famed for the quality of its mechanisms, and with a large homogeneous population of hardy people possibly fall so low as to be utterly conquered? And by the United States and others, for that matter? How could Japan, with its fanatical warriors and equally fanatical populace, its massive fleet and some of the best airplanes in the world – a combination that had humbled Russia, that had occupied Korea for nigh on 40 years, which easily set up puppet governments in Manchuria and China when and where it pleased – how could it have been defeated so wretchedly as to see its population literally decimated and its governance wholly supplanted? How could a god be dethroned?
It is perhaps not too much to say that investors in the United States, who say that the Treasury Bond has never failed to be redeemed and that the United States can never fall, are perhaps overconfident in their assessment. Inflation need not be hyper to cause losses. Greater nations have been destroyed quickly. Who remembers the days when the Dutch fought the English and the French to a standstill and ruled over the shipping lanes? Remember that Nineveh is one with the dust.
In short, our data on returns is biased. This bias indicates that stocks and cash are much more risky than most people think, and that this risk inheres in exogenous shocks to economies – it may seem odd to invest globally, in multiple currencies, just to avoid the rare black swans of total war and hyperinflation. But these risks are catastrophic risks. Even one may be too many.
This risk is more general. Governments can die, and so their bonds and other instruments (such as cash) rendered worthless; how many governments have died or defaulted over the last century? Many. The default assumption must be that the governments with good credit, who are not in that number, may simply have been lucky. And luck runs out.”
Here’s another:
“Why IQ doesn’t matter and how points mislead
One common anti-IQ arguments is that IQ does nothing and may be actively harmful past 120 or 130 or so; the statistical evidence is there to support a loss of correlation with success, and commentators can adduce William Sidis if they don’t themselves know any such ‘slackers’, or the Terman report’s similar findings.
This is a reasonable objection. But it is rarely proffered by people really familiar with IQ, who also rarely respond to it. Why? I believe they have an intuitive understanding that IQ is a percentile ranking, not an absolute measurement.
It is plausible that the 20 points separating 100 and 120 represents far more cognitive power and ability than that separating 120 and 140, or 140 and 160. To move from 100 to 120, one must surpass roughly 20% of the population; to move from 120 to 140 requires surpassing a smaller percentage, and 140–160 smaller yet.
Similarly it should make us wonder how much absolute ability is being measured at the upper ranges when we reflect that, while adult IQs are stable over years, they are unstable in the short-term and test results can vary dramatically even if there is no distorting factors like emotional disturbance or varying caffeine consumption.
Another thought: the kids in your local special ed program mentally closer to chimpanzees, or to Albert Einstein/Terence Tao? Pondering all the things we expect even special ed kids to learn (eg. language), I think those kids are closer to Einstein than monkeys.
And if retarded kids are closer to Einstein that the smartest non-human animal, that indicates human intelligence is very ‘narrow’, and that there is a vast spectrum of stupidity stretching below us all the way down to viruses (which only ‘learn’ through evolution).”
Incidentally, the 20 percent number is somewhat off – if you assume IQ is ~N(100,15), which is pretty standard, then by going from 100 to 120 you will pass by ~40 percent of all individuals, not 20. If you don’t have a good sense of the scale here, it’s a useful rule of thumb to know that ~2/3rds of the observations of a normally distributed variable will be within one standard deviation of the mean. When you jump from 120 to 140, you pass 8,7 percent of all humans, assuming ~N(100,15), a much smaller group of people.
But yeah, as to the rest of it, I have always had some problems with figuring out how to interpret IQ differences, in terms of how differences in IQ translates to differences in ‘human computing power’. And reading the above, it makes perfect sense that I’ve had problems with this, because that’s not easy at all. I wasn’t really thinking about the fact that the variable is at least as much about ordering the humans as it is about measuring the size of the CPU. That’s probably in part because I have an IQ much lower than Gwern.
Why g matters
The paper is here, here are some excerpts:
“personnel psychologists no longer dispute the conclusion that g helps to predict performance in most if not all jobs (Hartigan & Wigdor, 1989). Rather, their disputes concern how large the predictive validities are, often in the context of deciding the appropriate composition of a personnel selection battery. Estimates of the average validity of g across all jobs in the economy generally range between .3 and .5 (on a scale from 0 to 1.O), depending on how validities are corrected for unreliability in the criterion and restriction in range on the predictor (Hartigan & Wigdor, 1989).
These estimates are based primarily on studies that used supervisor ratings of job performance. Average validities are yet higher when performance is measured objectively.
Validities vary widely across different kinds of jobs, from a low of about .2 to a high of .8.” […] An especially important observation is that predictive validities vary systematically according to the overall complexity of the work involved.”
[…]
g can be said to be the most powerful single predictor of overall job performance. First, no other measured trait, except perhaps conscientiousness (Landy et al., 1994, pp. 271, 273), has such general utility across the sweep of jobs in the U.S. economy. More specific personality traits and aptitudes, such as extraversion or spatial aptitude, sometimes seem essential above and beyond g, but across a more limited range of jobs (e.g., Bat-rick & Mount, 1991; Gottfredson, 1986a).
Second, no other single predictor measured to date (specific aptitude, personality, education, experience) seems to have such consistently high predictive validities for job performance. The clearest exceptions to the predictive superiority of g prove its relative importance.”
[…]
“there are striking differences in the IQ ranges from which occupations tend to draw the bulk of their workers. More specifically, there appear to be minimum IQ thresholds that rise steadily with job level. The median of an applicant pool is often recommended as a minimum passing score for further consideration of applicants to that job (Wonderlic Personnel Test, 1992, p. 14), so it can be viewed as a threshold for applicant competitiveness. By this measure, one needs an IQ of about 120 (the 91st percentile of the general population) to be competitive for the highest level jobs in Figure 1 (research analyst and advertising manager). The IQ levels required for competitiveness drop with job level: for example, IQ 112 (81st percentile of the general adult population) for accountant and teacher; IQ 100 (50th percentile) for cashier, meter reader, and teller; IQ 90 (25th percentile) for custodian and material handler. The medians of the highest and lowest of these applicant IQ distributions (IQ 120 vs. 90) differ by 2 SD, which means these distributions do not overlap much.
If the 25th WPT percentile of applicants is used to estimate the minimum threshold for employability in an occupation, it suggests that virtually all occupations accommodate individuals down to IQ 110, but virtually none routinely accommodates individuals below IQ 80 (WPT 10). Employment options drop dramatically with IQ-from virtually unlimited above IQ 120 to scant below IQ 80. Such options are virtually nonexistent today (except in sheltered settings) for individuals below IQ 70 to 75, the usual threshold for borderline mental retardation.
Lest IQ 80 seem an unreasonably high (i.e., exclusionary) threshold in hiring, it should be noted that the military is prohibited by law (except under a declaration of war) from enlisting recruits below that level (the 10th percentile). That law was enacted because of the extraordinarily high training costs and high rates of failure among such men during the mobilization of forces in World War II (Laurence & Ramsberger, 1991; Sticht et al., 1987; U.S. Department of the Army, 1965).”
[…]
why does g have such pervasive practical utility? For example, why is a higher level of g a substantial advantage in carpentry, managing people, and navigating vehicles of all kinds? And, very importantly, why do those advantages vary in the ways they do? Why is g more helpful in repairing trucks than in driving them for a living? Or more for doing well in school than staying out of trouble? For example, IQ correlates .5 to .7 with academic achievement (Jensen, 1980, p. 319), but only -.25 with delinquency (Gordon, 1986). What explains this pattern of results?
Also, can we presume that similar activities in other venues might be similarly affected by intelligence? For example, if differences in intelligence change the odds of effectively managing and motivating people on the job, do they also change the odds of successfully dealing with one’s own children? If so, why, and how much?
The heart of the argument I develop here is this: For practical purposes, g is the ability to deal with cognitive complexity – in particular, with complex information processing. All tasks in life involve some complexity, that is, some information processing. Life tasks, like job duties, vary greatly in their complexity (g loadedness). This means that the advantages of higher g are large in some situations and small in others, but probably never zero.”
[…]
“variance in performance levels among workers rises with job complexity. Hunter et al. (1990) found that the ratios of SD in performance to mean performance were 19%, 32%, and 48%, respectively, in low-, medium-, and high-complexity civilian jobs. This means that the same differences in g lead to bigger differences in performance in more complex jobs, because g variance counts more heavily in those jobs.”
[…]
“Perhaps the most important conclusion to be drawn from these people-related ratings, however, is that dealing with people is always fairly complex. This should not be surprising, because other individuals are among the most complex, novel, changing, active, demanding, and unpredictable objects in our environments, Living and working with others is a complicated business.”
[…]
Education, training, experience, and the job knowledge to which they lead are all important aids in performing jobs well. This fact is aptly captured by discussions of the “practical intelligence” and “tacit knowledge” that is gained through experience (Jensen, 1993; Schmidt & Hunter, 1993; Sternberg & Wagner, 1993; Sternberg, Wagner, Williams, & Horvath, 1995). Raw intelligence is not enough, as the path analyses of intelligence, knowledge, and performance discussed earlier suggest. However, knowledge is merely a tool that people apply with different degrees of competence to an unending array of new situations – some potentially critical (engine failure in flight, an injured or trapped child, plunging sales, corporate mergers) and others less so (novel questions or complaints from customers, comparison shopping, applying and interviewing for jobs, setting behavioral standards for one’s adolescent children). As discussed earlier, the facility with which individuals accumulate these tools (trainability) and the competence with which they apply them (task proficiency) often depend heavily on g, especially in the absence of close supervision.
Complex Job Duties Have Everyday Analogs
Many of the duties that correlate highly with overall job complexity suffuse our lives: advising, planning, negotiating, persuading, supervising others, to name just a few. The job analysis tools used to analyze paid work could readily be adapted to analyze the nature of unpaid roles in life, such as parenting. One might ponder, for example, whether the most important elements of good parenting involve the duties associated with low complexity work such as driver, custodian, nurse’s aide, messenger, and food service worker – or whether they are more like the duties of moderate to high complexity jobs such as teacher, counselor, dispatcher, police officer, and accountant.”
[…]
Table 8 shows the percentages of White adults who are proficient at each of the five levels on the three NALS scales. Generally about 4% reach the highest level. Level 5 (376-500) signals an 80% probability, for example, of being able to summarize two ways that lawyers challenge prospective jurors (based on a passage discussing such practices) and to use a calculator to determine the total cost of carpet to cover a room (see Figure 2). Roughly another 20% of White adults reach Level 4 (326-375), where individuals can perform such tasks as restating an argument made in a lengthy news article and calculating the money needed to raise a child based on information stated in a news article.
A total of about one third of White adults reach Level 3 (276-325), but no higher, which includes capabilities for writing a brief letter explaining an error in a credit card bill and using a flight schedule to plan travel arrangements. Level 2 proficiency (226-275) includes locating an intersection on a street map, entering background information on an application for a social security card, and determining the price difference between two show tickets. This level is reached but not exceeded by about 25% of Whites. Finally, one out of seven White adults functions routinely no higher than Level 1 (less than 225), which is limited to 80% proficiency in skills like locating an expiration date on a driver’s license and totaling a bank deposit. Individuals at Level 1 or 2 “are not likely to be able to perform the range of complex literacy tasks that the National Education Goals Panel considers important for competing successfully in a global economy and exercising fully the rights and responsibilities of citizenship” (Baldwin et al., 1995, p. 16).”
…
The paper has much more.
Garett Jones’ paper
Plamus linked to it in the comments section and I’ve seen it linked elsewhere as well, it’s an interesting paper.
Here’s the abstract:
“A recent line of research demonstrates that cognitive skills—IQ scores, math skills, and the like — have only a modest influence on individual wages, but are strongly correlated with national outcomes. Is this largely due to human capital spillovers? This paper argues that the answer is yes. It presents four different channels through which intelligence may matter more for nations than for individuals: 1. Intelligence is associated with patience and hence higher savings rates; 2. Intelligence causes cooperation; 3. Higher group intelligence opens the door to using fragile, high-value production technologies, and 4. Intelligence is associated with supporting market-oriented policies. Abundant evidence from across the ADB region demonstrating that environmental improvements can raise cognitive skills is reviewed.”
I don’t buy 4 at all unless/before much more work is done in that field. Now it mostly just reads ‘I read Caplan’s book and people I know talk about it so I should probably mention it in my study’ to me. The other parts I don’t have strong opinions about. Below’s some stuff from the study and my remarks. Here’s Figure 1 from the paper, you have log-GDP pr. capita up the y-axis:

The ‘PRC’ in the corner is China, and there are plenty of reasons (the name of the most significant one is Mao) why you’d think it makes good sense that they haven’t managed as well as the theory suggests. The IQ-effect is huge: “Jones and Schneider […] found that across countries […]: 15 IQ points is associated with a 150 percent increase in productivity.” If you think simply in terms of labour input, this finding would suggest that in a country with an average IQ of 115, 2 average workers can be expected to add the same value to a product as (‘do the work of’) 5 workers living in a country with an average IQ of 100. Yet the private returns related to that productivity difference is very small; in the paper they mention an estimated wage differential of just 13 percent.
There’s a lot of stuff in the paper, I’ll just go through a few interesting bits I found. Here’s some stuff on environmental factors and their influence on IQ:
“there is a vast public health literature on environmental correlates of intelligence, and many of these papers study nations in Asia. A study of excessive fluoride in Indian drinking water found a 13 IQ point-difference between children “residing in two [separate] village areas of India with similar educational and socioeconomic conditions” (Trivedi et al. 2007, 178). If even half of this relationship is genuinely causal, and if intelligence has some of the technological and political spillover effects discussed below, then public health matters are of first-order concern for economic development.”
The impact of just two environmental factors of that size could in theory reduce the mean intelligence of a population with Mensa-level average IQ to that of current-day Japan. These effect sizes are huge.
“Arsenic and fluoride exposures are also associated with low IQ in the People’s Republic of China’s (PRC) Shanxi province (Wang et al. 2007, 664), even when comparing “groups [who] lived in rural areas with similar geographic and cultural conditions and a comparable level of socioeconomic development.” High arsenic exposure was associated with a 10-point IQ gap, and high fluoride exposure with a 4-point gap. In both cases, the “normal” group had an IQ of 105, 5 points above the US mean.
In the Visayas region of the Philippines, Solon et al. (2008) found evidence that lead levels reduced the IQ of children. In their study, one microgram of lead per liter of blood was associated with a 2.5 point reduction in the verbal IQ of older children, and a 3.3 point reduction in the IQ of young children. In their sample of children, the levels of lead in the blood averaged 7.1 micrograms per liter, so lead exposure could be costing the average child in this sample 15 IQ points even under conservative estimates.”
The role of nutrition is mentioned in the paper, but they don’t go much into the specifics. I’m pretty sure that’s one of the main things holding India back on the IQ-scale of Figure 1.
I think both point V and VI are only/mainly there because of the agenda of the authors and I hate that kind of thing. V is almost pure speculation using an already (with respect to which conclusions can be drawn from the findings) speculative voter preferences model from the US to talk about East Asia. Smarter people will be more likely to support free market policies if they think they’ll gain from it and they get a say in the matter, which depends mainly on how the local government decides to split up the cake. Show me a group of American professors of theoretical physics pushing for more free market policies in education (fewer gov. subsidies). No, that’s not the relevant margin, but to take an extreme example in the opposite direction, in a standard median voter model you could have an IQ increase of 30 points of the 4 top deciles having no effect on policies whatsoever, if the intelligence of the median voter is unchanged. Yeah, you might argue the IQ effects are to be had on the other side of the distribution, but model symmetry means that you could make the same argument and apply the change to the 4 lowest IQ deciles. Conceptually they probably just take up this subject to encourage further research, but I’m one of those people thinking that Caplan is drawing way too strong conclusions from his findings already, and using IQ proxies to speculate about effects in countries looking nothing like the US, having wastly different political systems – well, that’s just not very smart. Point VI is of the same kind – it smells of ‘we want to push this idea, how can we include it in the paper’-motivation. It mentions one way to increase a country’s IQ – immigration. From the paper:
“Even if scientists and public health officials quickly reach their limits in raising a person’s IQ—again, not a foregone conclusion — we still have a reliable tool for raising a nation’s IQ. Encourage immigration by individuals with higher average intelligence. Many countries implicitly do this by permitting high-skilled immigrants to enter and work legally.”
Nowhere in the paper is it mentioned that this is most likely a zero-sum game. One country’s gain is another country’s loss. And the ‘many countries implicitly do this…’ part is correct but only half of the story, as many countries, especially Western countries, also implicitly do the opposite – import massive amounts of low-IQ immigrants (and also implicitly form/maintain policies which encourage these people to have a lot of children, lowering national IQ and future human capital even further).
Wikipedia articles of interest
1. Avian IQ. Don’t know how good the sources are, but some of this stuff I found quite interesting. A few sentences from the article:
“Parrots have been shown to count up to 6.”
“New Caledonian Crows have been observed in the wild to use stick tools with their beaks to extract insects from logs. While young birds in the wild normally learn this technique from elders, a laboratory crow named “Betty” improvised a hooked tool from a wire with no prior experience.” [Apparently crows are very intelligent animals.]
“the brain-to-body size ratio of psittacines and corvines is actually comparable to that of higher primates.”
…
2. Land mine. From the article:
“Explosive land mines were being used in 1277 AD by the Song Dynasty Chinese against an assault of the Mongols, who were besieging a city in southern China.”
[…]
“Many mines combine the main trigger with a touch or tilt trigger to prevent enemy engineers from defusing it. Land mine designs tend to use as little metal as possible to make searching with a metal detector more difficult; land mines made mostly of plastic have the added advantage of being very inexpensive.” […] “Whereas the placing and arming of mines is relatively inexpensive and simple, the process of detecting and removing them is typically expensive, slow, and dangerous.”
[…]
“Anti-personnel mines are designed to kill or injure enemy combatants as opposed to destroying vehicles. They are often designed to injure rather than kill in order to increase the logistical support (evacuation, medical) burden on the opposing force.” [another reason why War Is Hell..]
[…]
“Placing minefields without marking and recording them for later removal is considered a war crime under Protocol II of the Convention on Certain Conventional Weapons, which is itself an annex to the Geneva Conventions.”
…
3. Meyer Lansky.
…
4. Coral Reef.

“Often called “rainforests of the sea”, coral reefs form some of the most diverse ecosystems on Earth. They occupy less than one tenth of one percent of the world ocean surface, about half the area of France, yet they provide a home for twenty-five percent of all marine species”
[…]
“Live coral are small animals embedded in calcium carbonate shells. It is a mistake to think of coral as plants or rocks. Coral heads consist of accumulations of individual animals called polyps, arranged in diverse shapes.[25] Polyps are usually tiny, but they can range in size from a pinhead to a foot across. Reef-building or hermatypic corals live only in the photic zone (above 50 m depth), the depth to which sufficient sunlight penetrates the water for photosynthesis to occur. Coral polyps do not themselves photosynthesize, but have a symbiotic relationship with single-celled organisms called zooxanthellae; these organisms live within the tissues of polyps and provide organic nutrients that nourish the polyp. Because of this relationship, coral reefs grow much faster in clear water, which admits more sunlight. Indeed, the relationship is responsible for coral reefs in the sense that without their symbionts, coral growth would be too slow for the corals to form significant reef structures. Corals get up to 90% of their nutrients from their zooxanthellae symbionts.”
…
5. Map projection.
“A map projection is any method of representing the surface of a sphere or other three-dimensional body on a plane. Map projections are necessary for creating maps. All map projections distort the surface in some fashion. Depending on the purpose of the map, some distortions are acceptable and others are not; therefore different map projections exist in order to preserve some properties of the sphere-like body at the expense of other properties. There is no limit to the number of possible map projections.”
Here’s a two-point equidistant projection of Asia (and Europe, and a big chunk of Oceania, and part of Africa – anyway…):

…
6. Operation Freakout. The Fair Game article has more. Lawsuits and character assasination attempts, using an elaborate scheme to try to frame the individual for a crime she didn’t commit. Now that’s the a Western way of doing things. Radical muslims just send a guy armed with an ax to your house.
Superfreakonomics (1,5?)
Have read the first 100 pages now, a few interesting passages from the book:
1) “In the early 1910s, the Department of Justice conducted a census of 310 cities in 26 states to tally the number of prostitutes in the United States: “We arrive at the conservative figure of approximately 200,000 women in the regular army of vice.”
At the time, the American population included 22 million women between the ages of fifteen and forty-four. If the DOJ numbers are to be believed, 1 og every 110 women in that age range was a prostitute. But most prostitutes, about 85 percent, were in their twenties. In that age range, 1 of every 50 American women was a prostitute.
The market was particularly strong in Chicago, which had more than 1000 known brothels.”
…
2) “Teaching has traditionally been dominated by women. A hundred years ago, it was one of the few jobs available to women that didn’t involve cooking, cleaning, or other menial labor. (Nursing was another such profession, but teaching was far more prominent, with six teachers for every nurse.) At the time, nearly 6 percent of the female work-force were teachers, trailing only laborers (19 percent), servants (16 percent), and laundresses (6,5 percent). […] As of 1940, an astonishing 55 percent of all college-educated female workers in their thirties were employed as teachers.”
Yes, the teacher numbers are interesting, but damn, so are the others – a 100 years ago, appr. 1 in 6 women employed were servants! Here’s a bit more:
“In 1960, about 40 percent of female teachers scored in the top quintile of IQ and other aptitude tests, with only 8 percent in the buttom. Twenty years later, fewer than half as many were in the top quintile, with more than twice as many in the buttom.”
Combine this fact and the development since then with the Flynn effect and you get at least part of the explanation why teachers were more respected in the past. They, and especially the females, were much smarter on average.
…
3) “Alan Krueger combed through a Hezbollah newsletter called Al-Ahd (The Oath) and compiled biographical details on 129 dead shahids (martyrs). He then compared them with men from the same age bracket in the general populace of Lebanon. The terrorists, he found, were less likely to come from a poor family (28 percent versus 33 percent) and more likely to have at least a high-school education (47 percent versus 38 percent).
A similar analysis of Palestinian suicide bombers by Claude Berrebi found that only 16 percent came from impoverished families, versus more than 30 percent of male Palestinians overall. More than 60 percent of the bombers, meanwhile, had gone beyond high school, versus 15 percent of the populace.
In general, Krueger found, “terrorists tend to be drawn from well-educated, middle-class or high-income families”.”
…
4) “The beauty of terrorism – if you’re a terrorist – is that you can succeed even by failing. […] Let’s say it takes an average of one minute to reomve and replace your shoes in the airport security line. In the United States alone, this procedure happens roughly 560 million times per year. Five hundred and sixty million minutes equals more than 1,065 years – which, divided by 77.8 years (the average U.S. life expectancy at birth), yields a total of nearly 14 person-lives. So even though Richard Reid [the failed shoe bomber] failed to kill a single person, he levied a tax that is the time equivalent of 14 lives per year.”
…
5) “Until the 1960s, hospitals simply weren’t designed to treat emergencies. “If you brought someone to a hospital at night,” Feied [Craig Feied, according to the book ‘an emergency-medicine specialist’] says, “the doors would be locked. You’d ring the bell, a nurse would come down to see what you wanted. She might let you in, then she’d call the doctor at home, and he might or might not come in.” Ambulances were often run by the local mortuary. It is hard to think of a better example of misaligned incentives: a funeral director who is put in charge of helping a patient not die!”
[…]
“In a given year, an excellent ER doctor’s patients will have a twelve-month death rate that is nearly 10 percent lower than the average. This may not sound like much, but in a busy ER with tens of thousands of patients, an excellent doctor might save six or seven lives a year relative to the worst doctor.”
‘No, it doesn’t sound like much and that really isn’t a big difference’ I’d say, unless you’re one of those six or seven marginal people of course. But the difference between the best and an average ER doctor seems to be quite small – it’s probably much bigger in other specialties. A Dane at the age of 30 can expect to live 8,5 years more if he’s never smoked than if he’s a heavy smoker, so a GP who’s good at making people stop smoking will save dozens of lives every year on that count alone.
…
6) “More than $40 billion is spent worldwide each year on cancer drugs.”
(I’d have thought the number was bigger than that)
“cancer patients make up 20 percent of Medicare cases but consume 40 percent of the Medicare drug budget.”
“A typical chemotherapy regime for non-small-cell lung cancer costs more than $40,000 but helps extend a patient’s life by an average of just two months.”
…
I like the book so far.
Recent Comments
Sabra Zaraa on Cost-effectiveness analysis in… adityaguharoy on Combinatorics (I) therookswinger on Magnus Carlsen playing bullet… Stefan on Quotes US on Quotes Goodreads Quotes
Usfromdk’s quotes
"Happiness and its anticipation are […] proximate mechanisms that lead us to perform and repeat acts that in the environments of history, at least, would have led to greater reproductive success." (Richard D. Alexander)Statcounter
