Quotes
i. “Every age has its peculiar folly; some scheme, project, or phantasy into which it plunges, spurred on either by the love of gain, the necessity of excitement, or the mere force of imitation. Failing in these, it has some madness, to which it is goaded by political or religious causes, or both combined.” (Charles Mackay)
ii. “Men, it has been well said, think in herds; it will be seen that they go mad in herds, while they only recover their senses slowly, and one by one.” (-ll-)
iii. “Credulity is always greatest in times of calamity.” (-ll-)
iv. “Women liked nothing better than making you defend yourself, and once you started, she had won.” (Robert Jordan, Knife of Dreams, Book Eleven of The Wheel of Time (p. 198)).
v. “….what adventure is worth leaving your wife to die alone?” (Robert Jordan, Knife of Dreams, Book Eleven of The Wheel of Time (p. 200)).
vi. “I have always been ready to die for her.” […] “Better to live for her, though, wouldn’t you say?” (Robert Jordan, Knife of Dreams, Book Eleven of The Wheel of Time (p. 816))
vii. “Being in control wasn’t so much about the power you had, but the power you implied that you had.” (Robert Jordan, The Gathering Storm, Book 12 of The Wheel of Time (p. 116))
viii. “He felt like going drinking, forgetting who he was — and who people thought he was — for a while. But if he got drunk, he was likely to let his face show by accident. Perhaps begin to talk about who he really was. You never could tell what a man would do when he was drunk, even if that man was your own self.” (Robert Jordan, Towers of Midnight, Book 13 of The Wheel of Time (p. 349))
ix. “He glanced at himself in the glass’s reflection, making certain the coat was straight. Small things were important. Seconds were small things, and if you heaped enough of those on top of one another, they became a man’s life.” (Robert Jordan, Towers of Midnight, Book 13 of The Wheel of Time (p. 679))
x. “There seems to be an idealistic form of geek thinking that holds that if only we made decisions better, we would never make mistakes. I was a young adherent, a worshipper at the altar of “If Only I Were Infinitely Smart.” Fortunately, I got over it. I learned the value of reversibility […] and realized the value of making decisions reversible. […] In general, we should treat reversible decisions differently than irreversible decisions. There’s great value in reviewing, double-checking, triple-checking irreversible decisions. The pace should be slow and deliberate. […] How about reversible decisions? Most software design decisions are easily reversible. […] we can so easily reverse a decision if it turns out to be wrong. Because there is so little value to avoiding mistakes, we shouldn’t invest much in doing so.” (Kent Beck, Tidy First? (pp. 103-105))
xi. “Software development and architecture have patterns and antipatterns that can be applied (or recognized) in writing code and architecting systems. A pattern is a reusable solution that has been shown to be effective when used to solve a problem. […] Antipatterns are not the direct opposite of patterns. They are solutions that look like they solve a problem but have consequences that outweigh any potential benefits. […] This book applies the concept of patterns and antipatterns to communication. People often quote Brian Foote and Joseph Yoder’s 1997 paper “Big Ball of Mud” (and for good reason): “If you think good architecture is expensive, try bad architecture.” It means that creating good architecture requires an investment, but not investing will result in bad architecture that costs more in the long run. The same thing should be said for communication: If you think good communication is expensive, try bad communication. Investing in good (successful) communication is less expensive than bearing the costs of bad (unsuccessful) communication.” (Jacqui Read, Communication Patterns (pp. 10-11)).
xii. “Mixing levels of abstraction is a communication antipattern that has a counterpart in the coding world. If you have ever coded, you will likely know mixing levels of abstraction as a sin or a code smell.2 Although putting all the information someone could need into one diagram might seem appropriate, this leads to clutter and confusion from the audience’s perspective. […] Using different levels of abstraction across multiple diagrams allows you to communicate appropriately for the audience, while still ensuring that all relevant information is captured. […] The C4 model is a hierarchy of abstractions. It uses an abstraction first approach (prioritizing abstraction and building everything else around it). […] C4 models, based around a hierarchy of abstractions, are an excellent way to illustrate the need to keep levels of abstraction separate in diagrams. This separation rule applies to all types of diagrams.” (ibid, pp. 28-33)
xiii. “It does make me feel guilty, the knight notes, that we have to treat them like this. They’re victims too.
It was truth, but one that Nomad had long ago made peace with. You didn’t always get to fight the right people. In fact, you often had to fight the wrong ones — at least until you could stop the men and women who gave the orders.” (Brandon Sanderson, The Sunlit Man, p. 327)
xiv. “The best of our fiction is by novelists who allow that it is as good as they can give, and the worst by novelists who maintain that they could do much better if only the public would let them.” (J. M. Barrie)
xv. “Never ascribe to an opponent motives meaner than your own.” (-ll-)
xvi. “I’m not young enough to know everything.” (-ll-)
xvii. “The life of every man is a diary in which he means to write one story, and writes another; and his humblest hour is when he compares the volume as it is with what he vowed to make it.” (-ll-)
xviii. “Shall we make a new rule of life from tonight: always to try to be a little kinder than is necessary?” (-ll-)
xix. “Worry never robs tomorrow of its sorrow, but only saps today of its strength.” (Archibald Joseph Cronin)
xx. “On the morning of 16 December General Middleton’s VIII Corps had a formal corps reserve consisting of one armored combat command and four engineer combat battalions. In dire circumstances Middleton might count on three additional engineer combat battalions which, under First Army command, were engaged as the 1128th Engineer Group in direct support of the normal engineer operations on foot in the VIII Corps area. In exceptionally adverse circumstances, that is under conditions then so remote as to be hardly worth a thought, the VIII Corps would have a last combat residue-poorly armed and ill-trained for combat-made up of rear echelon headquarters, supply, and technical service troops, plus the increment of stragglers who might, in the course of battle, stray back from the front lines. General Middleton would be called upon to use all of these “reserves.” Their total effect in the fight to delay the German forces hammering through the VIII Corps center would be extremely important but at the same time generally incalculable, nor would many of these troops enter the pages of history.1
A handful of ordnance mechanics manning a Sherman tank fresh from the repair shop are seen at a bridge. By their mere presence they check an enemy column long enough for the bridge to be demolished. The tank and its crew disappear. They have affected the course of the Ardennes battle, even though minutely, but history does not record from whence they came or whither they went. A signal officer checking his wire along a byroad encounters a German column; he wheels his jeep and races back to alert a section of tank destroyers standing at a crossroad. Both he and the gunners are and remain anonymous. Yet the tank destroyers with a few shots rob the enemy of precious minutes, even hours. A platoon of engineers appears in one terse sentence of a German commander’s report. They have fought bravely, says the foe, and forced him to waste a couple of hours in deployment and maneuver. In this brief emergence from the fog of war the engineer platoon makes its bid for recognition in history. That is all. A small group of stragglers suddenly become tired of what seems to be eternally retreating. Miles back they ceased to be part of an organized combat formation, and recorded history, at that point, lost them. The sound of firing is heard for fifteen minutes, an hour, coming from a patch of woods, a tiny village, the opposite side of a hill. The enemy has been delayed; the enemy resumes the march westward. Weeks later a graves registration team uncovers mute evidence of a last-ditch stand at woods, village, or hill.” (Hugh Cole, The Ardennes: The Battle of the Bulge (US Military History of WW II), chapter XIV).
Montemayor’s youtube channel
Here’s the link. Not many videos, but quality over quantity. This is wonderful stuff.
Quotes
i. “You can never know everything, […] and part of what you know is always wrong. Perhaps even the most important part. A portion of wisdom lies in knowing that.” (Robert Jordan, Winter’s Heart: Book Nine of The Wheel of Time (p. 619))
ii. “It is the enemy you underestimate who kills you.” (Robert Jordan, A Crown of Swords: Book Seven of The Wheel of Time (p. 247))
iii. “When a woman plays the fool, look for the man.” (Robert Jordan, The Path of Daggers: Book Eight of The Wheel of Time (p. 75))
iv. “A secret spoken finds wings.” (Robert Jordan, The Path of Daggers: Book Eight of The Wheel of Time (p. 437))
v. “The worst mistake is to make the same one twice” (Robert Jordan, The Path of Daggers: Book Eight of ‘The Wheel of Time’ (p. 473)
vi. “A distributed system is one in which the failure of a computer you didn’t even know existed can render your own computer unusable.” (Leslie Lamport, as quoted in Sam Newman’s Building Microservices, 2nd edition (p. 17)).
vii. “Unfortunately, people have come to view the monolith as something to be avoided — as something inherently problematic. I’ve met multiple people for whom the term monolith is synonymous with legacy. This is a problem. A monolithic architecture is a choice, and a valid one at that. I’d go further and say that in my opinion it is the sensible default choice as an architectural style. In other words, I am looking for a reason to be convinced to use microservices, rather than looking for a reason not to use them.” (Sam Newman, Building Microservices, 2nd edition (p. 18))
viii. “The connections between modules are the assumptions which the modules make about each other.” (David Parnas, as quoted in Sam Newman’s Building Microservices, 2nd edition (p. 37)
ix. “…he had quickly learned one thing from being a king: the more authority you gained, the less control you had over your life. […] Being in control wasn’t so much about the power you had, but the power you implied that you had.” (Robert Jordan, The Gathering Storm: Book 12 of the Wheel of Time (pp. 104, 116))
x. “He wasn’t stupid; he just liked to think about things. But he’d never been good with people […]. Faile had shown him that he didn’t need to be good with people, or even with women, as long as he could make one person understand him. He didn’t have to be good at talking to anyone else as long as he could talk to her.” (Robert Jordan, The Gathering Storm: Book 12 of the Wheel of Time (p. 162))
xi. Sometimes […] we are so concerned with the things we have done that we do not stop to consider the things we have not.” (Robert Jordan, The Gathering Storm: Book 12 of the Wheel of Time (p. 245))
xii. “A general who draws his sword has put aside his baton and become a common soldier.” (Robert Jordan, Knife of Dreams: Book Eleven of ‘The Wheel of Time (p. 816))
xiii. “Always plan ahead, […] but worry too hard over next year, and you can trip over tomorrow.” (Robert Jordan, Crossroads of Twilight: Book Ten of ‘The Wheel of Time (p. 302))
xiv. “Change came so slowly you never noticed it creeping up on you, or far too fast for comfort, but it came. Nothing stayed the same, even when you thought it did. Or hoped it would.” (Robert Jordan, Crossroads of Twilight: Book Ten of ‘The Wheel of Time (p. 356))
xv. “…even oaths of fealty left room for the most loyal people doing the worst possible thing in the belief that it was in your best interest.” (Robert Jordan, Crossroads of Twilight: Book Ten of ‘The Wheel of Time (p. 364))
xvi. “…she had no more idea how to deal with being in love than a duck had about shearing sheep.” (Robert Jordan, Crossroads of Twilight: Book Ten of ‘The Wheel of Time (p. 394))
xvii. “…nothing at all had been decided except that more talk was necessary before anything could be decided.” (Robert Jordan, Crossroads of Twilight: Book Ten of ‘The Wheel of Time (p. 425))
xiii. “People never really changed, yet the world did, with disturbing regularity. You just had to live with it, or at least live through it. Now and then, with luck, you could affect the direction of the changes, but even if you stopped one, you only set another in motion.” (Robert Jordan, Crossroads of Twilight: Book Ten of ‘The Wheel of Time (p. 474))
xix. “Sometimes a man just had to live with it. Most of the time, since there was nothing else to do.” (Robert Jordan, Crossroads of Twilight: Book Ten of ‘The Wheel of Time (p. 500))
xx. ““When you go to buy a sack of flour,” she said, “wear plain wool so the seller thinks you can’t afford to pay any more than you must. When you’re after flour by the wagonload, wear jewels so she thinks you can afford to come back for all she can lay hands on.” […] Dress poor when you want a small favor, and fine when you want a large one.” (Robert Jordan, Crossroads of Twilight: Book Ten of ‘The Wheel of Time (p. 501))
Quotes
i. “Do what you must, then pay the price for it, was what she had been taught, by the same women who had marked off those forbidden areas. It was refusal to admit the debt, refusal to pay, that often turned necessity to evil.” (A Crown of Swords (p. 230), Robert Jordan)
ii. “Wounds to the pride are remembered long after wounds to the flesh.” (-ll-, p. 238)
iii. “…a general can take care of the living or weep for the dead, but he cannot do both.’” (The Shadow Rising (p. 686), Robert Jordan)
iv. “He strains to hear a whisper who refuses to hear a shout.” (The Fires Of Heaven (p. 264), Robert Jordan)
v. “I take people as they are, not as I would like them to be, or else I leave them.” (The Fires Of Heaven (p. 538), Robert Jordan).
vi. “Only a battle lost is sadder than a battle won.” (-ll- (p. 655))
vii. “An open sack hides nothing, and an open door hides little, but an open man is surely hiding something.” (-ll- (p. 730))
viii. “…hard times make people willing to accept a man who preaches change.” (Elantris (p. 106), Brandon Sanderson)
ix. “…As was often the case, the most outspoken man was the least discerning.” (-ll-, (p. 113))
x. “…it was beneficial to have a reputation for honesty, if only so that one could lie at crucial moments.” (-ll-, (pp. 114-115))
xi. “Perhaps he had been looking for that branching point in his life where he had stepped down the wrong path.
He hadn’t understood. There was rarely an obvious branching point in a person’s life. People changed slowly, over time. You didn’t take one step, then find yourself in a completely new location. You first took a little step off a path to avoid some rocks. For a while, you walked alongside the path, but then you wandered out a little way to step on softer soil. Then you stopped paying attention as you drifted farther and farther away. Finally, you found yourself in the wrong city, wondering why the signs on the roadway hadn’t led you better.” (The Emperor’s Soul (p. 71), Brandon Sanderson)
xii. “Every man had to die. He’d always found it odd that so many died when they were old, as logic said that was the point in their lives when they’d had the most practice not dying.” (Shadows of Self (pp. 79-80), Brandon Sanderson)
xiii. “The law is not something holy, son. It’s just a reflection of the ideals of those lucky enough to be in charge.” (Shadows of Self (p. 277), Brandon Sanderson)
xiv. ““There has to be a balance, Vin,” […] The balance between who we wish to be and who we need to be.” […] “But for now,” he said, nodding to the side, “we simply have to be satisfied with who we are.”” (The Hero of Ages (p. 155), Brandon Sanderson)
xv. ““A man is what he has passion about,” Breeze said. “I’ve found that if you give up what you want most for what you think you should want more, you’ll just end up miserable.” (-ll-, (p. 343))
xvi. “Beauty seen is never lost.” (John Greenleaf Whittier)
xvii. “Skills used unselfishly make for cooperation.” (Robert Holdstock)
xviii. “Every breath you take is a step towards death.” (Ali, Nahj al-Balagha, Sayings: 74)
xix. “‘Bogdan.’ Stephen finally looks up. ‘I’m not a fool. Well, no more than any of us. I miss things from time to time, people don’t quite make the sense they did.’ Bogdan nods. ‘My father, God rest him, lost himself towards the end. In those days they said he went doolally – probably that’s not what we say these days.’ ‘I don’t think we do,’ agrees Bogdan. ‘“Where’s your mother?” he would ask me sometimes.’ Stephen moves a piece on the board. A holding move, nothing risked, nothing gained. ‘Only, my mother had died, many years previously.’ Bogdan is looking down at the board now. Let Stephen talk. Only answer a question if one is asked. ‘So, you see,’ says Stephen, ‘why it might worry me that I don’t know where Elizabeth is today?’ […] ‘We all forget things, Stephen.’ Stephen smiles, and nods. ‘Very clever. But you would tell me? You would tell me if something was up? I can’t ask Elizabeth. I don’t want to worry her.’ Again, Stephen has asked Bogdan this question a number of times. And Bogdan always answers in the same way. ‘Would I tell you? Honestly, I don’t know. What would you do, if it was someone you loved?’ ‘I suppose if I felt it would help, then I would tell them,’ says Stephen. ‘And if I felt it wouldn’t help, then I wouldn’t tell them.’ Bogdan nods. ‘I like that. I think that is right.’ ‘But you think I’m all right? A bit of fuss over nothing?’ ‘That’s exactly what I think, Stephen,’ says Bogdan, and moves one of his pawns further up the board.” (…for context: Stephen is suffering from dementia. The way Osman handled these topics in this book made me cry, he understands these things better than any human should ever need to. Quote from The Bullet That Missed, Richard Osman, p. 255)
xx. “‘It’s the people, in the end, isn’t it?’ says Viktor. ‘It’s always the people. You can move halfway around the world to find your perfect life, move to Australia if you like, but it always comes down to the people you meet.’” (-ll-) (p. 407)
Books 2023
I try to make a post like this one every year.
Below I have included a list of the 57 books I’ve read and reviews I’ve shared throughout the year, as well as some comments and reflections.
The average page count of the books I read in 2023 was the highest ever for me – either 572 or 550 pages per book on average, depending on how you calculate it. Details are included below. So there are not many ‘easy reads’ featuring on this list. This is also the obvious reason for the low number of books featuring on the list.
I really like the visual overviews generated by book tracking resources like goodreads or TheStoryGraph (-TSG) so I decided to include screenshots of the overview auto-generated at the end of the year in this post. You can see the TSG view below. You can’t interact with the visual overview below the way you can with the overview on the site, but I’ve learned to not take for granted that these sites will necessarily be available/accessible/functional in the future and I know that the visual overview included in this post will be functional even if the source site which generated the views goes down later on, which is desirable from my perspective.
Below the visual overview I have added some more comments and details, and at the end of the post I also included the usual list in the format that has become the standard format for this blog, with author/publisher/rating information as well as various comments and links to reviews I’ve written about the books.


Here’s a link to the overview, I think it should be available to you even if you do not have a profile on TSG.
…
Okay, on to the details.
24 out of the 57 books, or 42%, were non-fiction books. Of the non-fiction books I read I would categorize 19 of them as relevant to my work to some extent, excluding from the non-fiction list only the three 100 Cases… medical textbooks, the Oxford Handbook of Pain Management, and The Fall of Rome. Some of the others turned out to be of limited relevance, but I read them because I didn’t know this at the point in time where I started reading them. I had a desire at the start of the year to read more non-fiction relevant to my work, and in that I succeeded. I take some pride in the fact that there are basically no ‘very short introductions’ included on the list; a substantial proportion of the non-fiction books I read had page counts north of 500 pages, which they would need to have for the non-fiction books not to drag down the average.
Whereas I read a little more than 100 pages per day in 2022, in 2023 I read somewhere between 85 and 90 pages per day, depending on which metric you use – TheStoryGraph (-TSG) logged 31.374 pages, which divided by 365 is ca. 86 pages/day; so although I only read roughly half as many books this year as I did last year, the number of pages I read was not really that different. Although TSG includes a lot of books, the page counts linked to the specific editions do not always match the page counts of the books you might be reading yourself. When I for the second time this year experienced that a highly technical 800+ pages textbook was logged at 500-something pages on TSG, I had had enough with their reported numbers and I started explicitly tracking on this myself, by adding comments to the book entries in the list if the page count of the version I read was substantially different from the one reported on TSG – I knew that the page count metric would be the only one I’d care about this year, so I wanted to get it right. So, if you adjust for page counts which were different in the versions I read and the versions included in TSG, then the total page count of the books I read during the year increases by 1248 pages, to 32.622 pages in total, or 89,4 pages/day.
The average page count of the books I read was 550 (31.374/57), or 572 (32.622/57), depending on which of the two metrics you prefer. The page count dropped somewhat at the end of the year; I know that I was above 600 pages for most of the year, and for example by mid-September the average page count of the books I had finished was 620 pages.
Not all pages are equal, though. There is also the question of word counts per page, which varies across books. According to the handy list on Wikipedia here, Robert Jordan’s Wheel of Time series clocks in at 4,3 million words (4.305.057) words, which at a standard format of 250-300 words/page (let’s say 275) would translate to 15.654 pages, or more than 1000 pages per book; although some of the books in the series I read had 1000+ pages, many of them did not, so they are presumably denser than what is standard for fiction reading.
To make a comparison between Jordan and something people might be familiar with, the 7 Harry Potter books has a total word count of ca. 1,1 million words (1.084.170) – so the 15 Wheel of Time books alone corresponds to roughly 28 HPbu’s (‘Harry Potter book units’). Although the Jordan books are at the extreme end of this spectrum I feel quite confident they’re not the only books in this type of category this year; Sanderson’s Stormlight Archive can be taken as another example, although it’s less pronounced as both Words of Radiance and Oathbringer were split into two books by the publisher – even so, the 6 (/8) published books in that series included in the list clocks in at 1.787.571 words according to the linked Wikipedia page, translating to 6.500 pages in standard 250-300 (275)-word-format pages; the wiki hardback word counts included in the wiki page are substantially lower than this and I’m fairly confident the versions I read were as well.
Note that the two series above alone make up 6+ million words, and account for only 23 of the 57 books I read throughout the year. I think it was a decent year in terms of the books I read, even if the ‘book count’ was far from impressive.
You can see the full list of books below.
…
1. The Way of Kings (The Stormlight Archive #1) (5, f. Brandon Sanderson).
2. Words of Radiance, Part 1 (The Stormlight Archive #2a) (5, f. Brandon Sanderson). Review here.
3. Words of Radiance, Part 2 (The Stormlight Archive #2b) (5, f. Brandon Sanderson). Short review here (…you’ll have to trust me on the fact that the puns I included in the review make a lot more sense after you’ve read the book…).
4. The Mythical Man-Month: Essays on Software Engineering, Anniversary Edition (3.0, nf. Frederick P. Brooks Jr., Addison-Wesley Professional). Work-related.
5. Edgedancer (The Stormlight Archive #2.5) (5, f. Brandon Sanderson). Review here.
6. The Pragmatic Programmer: From Journeyman to Master (3, nf. Hunt & Thomas, Pearson Education, Inc.). Work-related. Blog post here.
7. Data Engineering with AWS (2.5, nf. Gareth Eagar, Packt Publishing). Work-related. Short review here. Note that the page count given in TheStoryGraph link does not match my version of the book; my version has 662 pages, rather than the 482 pages indicated in the linked book profile page).
8. Oathbringer Part One (The Stormlight Archive #3a) (4.5, f. Brandon Sanderson).
9. A Philosophy of Software Design (4.5, nf. John Ousterhout, Yaknyam Press). Work-related, I shared many insights from this book with other members of my team, it’s full of good stuff. As I put it in my very short review, “An excellent little book, my main criticism would be that it’s too short.”
10. Oathbringer: Part Two (The Stormlight Archive #3b) (4.75, f. Brandon Sanderson).
11. Dawnshard (The Stormlight Archive #3.5) (4.25, f. Brandon Sanderson). Short review here.
12. Fundamentals of Data Engineering: Plan and Build Robust Data Systems (5, nf. Housley & Reis, O’Reilly Media). Work-related, an excellent book.
13. Rhythm of War (The Stormlight Archive #4). (5, f. Brandon Sanderson). Short review here. Like some of the other books in the series, this book is just ridiculously long – but that should not stop you from reading it.
14. Warbreaker (3.75, f. Brandon Sanderson).
15. SQL Cookbook: Query Solutions and Techniques for All SQL Users (2.5, nf. de Graaf & Molinaro, O’Reilly Media). Work-related. Long-ish review here. Note that the page count in TheStoryGraph does not match my version of the book; my version has 814 pages, rather than the 572 pages indicated in the linked book profile page. As I also mention in my review, this book did not need to include 814 pages in order to cover the material it does; this is one of the reasons why the rating is not higher than it is.
16. Tress of the Emerald Sea (Secret Projects #1) (4.0, f. Brandon Sanderson). Very short review here.
17. Data Quality Fundamentals (3.75, nf. Gavish, Moses & Vorwerck, O’Reilly Media). Work-related.
18. The Frugal Wizard’s Handbook for Surviving Medieval England (Secret Projects #2) (3.25, f. Brandon Sanderson).
19. New Spring (The Wheel of Time #0) (4.5, f. Robert Jordan). Short review here.
20. Observability Engineering (nf. Majors, Fong-Jones & Miranda, O’Reilly Media). Review here.
21. The Eye of the World (The Wheel of Time #1) (4.5, f. Robert Jordan). Very short review here.
22. The Great Hunt (The Wheel of Time #2) (5, f. Robert Jordan).
23. The Dragon Reborn (The Wheel of Time #3) (4.5, f. Robert Jordan).
24. The Shadow Rising (The Wheel of Time #4) (5.0, f., Robert Jordan). Short review here.
25. The Fires of Heaven (The Wheel of Time #5) (4.25, f. Robert Jordan).
26. Data Engineering with Python (2.25, nf. Paul Crickard, Packt Publishing). A somewhat disappointing read. The page count reported on TheStoryGraph was off by ca. 100 pages; my version had 464 pages, rather than the 356 pages logged on TSG. Despite the fact that the book was not all that great it did lead to a conversation with a colleague about Apache Airflow which eventually lead to us starting to use Airflow.
27. Lord of Chaos (The Wheel of Time #6) (4.5, f. Robert Jordan)
28. A Crown of Swords (The Wheel of Time #7) (4.25, f. Robert Jordan)
29. The Path of Daggers (The Wheel of Time #8) (4.25, f. Robert Jordan)
30. Das Boot (5.0, f. Lothar-Günther Buchheim). There was no way to justify not giving this book 5 stars, but as I pointed out in the review I wrote on Thestorygraph, “This book is definitely not for everybody”.
31. Data Mesh: Delivering Data-Driven Value at Scale (5, nf. Zhamak Dehghani, O’Reilly Media). Work-related, very much worth reading; I recommended this book to several of my work colleagues.
32. Winter’s Heart (The Wheel of Time #9) (4.25, f. Robert Jordan)
33. Crossroads of Twilight (The Wheel of Time #10) (4.5, f. Robert Jordan)
34. Knife of Dreams (The Wheel of Time #11) (4.5, f. Robert Jordan)
35. Kafka: The Definitive Guide: Real-Time Data and Stream Processing at Scale (nf. Shapira, Palino & Narkhede, O’Reilly Media). The page count reported on TheStoryGraph was off by more than 300 pages – their 2nd edition was logged at 488 pages, whereas the version I read had 817 pages. This book takes a significant amount of work to read cover to cover. My org.’s at the time of writing in the process of implementing Kafka (this was why I read the book), I felt it was premature to rate the book for this reason.
36. Building Event-Driven Microservices: Leveraging Organizational Data at Scale (3.0, nf. Adam Bellemare, O’Reilly Media). TheStoryGraph’s version of the book underestimated the book’s page count by ca. 60 pages; their version was logged at 324 page whereas the version I read contained 385 pages.
37. The Gathering Storm (The Wheel of Time #12) (4.75, f. Robert Jordan)
38. Towers of Midnight (The Wheel of Time #13) (4.5, f. Robert Jordan)
39. Building Microservices: Designing Fine-Grained Systems (4.5, nf. Sam Newman, O’Reilly Media). Review here.
40. Death in the Clouds (3.0, Agatha Christie, Poirot #12). Short review here.
41. 4:50 from Paddington (Agatha Christie, Miss Marple #8). Short review here.
42. Value Stream Mapping (2.0, nf. Osterling & Martin, McGraw Hill). Very short review here.
43. Team Topologies: Organizing Business and Technology Teams for Fast Flow (4.75, nf. Pais & Skelton, IT Revolution Press). I decided after having read this book to set up knowledge sharing sessions covering material from the book with both my team colleagues and with a senior director. I got positive feedback from both parties. From my review of the book: “This is an important book you’ll probably want to read.”
44. The Early Cases of Hercule Poirot (2.0, f. Agatha Christie)
45. Miss Marple 3-Book Collection 1: The Murder at the Vicarage, The Body in the Library, The Moving Finger (2,5, f. Review here). The page count reported on TheStoryGraph was off by more than 100 pages – on TSG this one was set to 667 pages, but my Kindle version of the book(s) had 804 pages.
46. 100 Cases in Clinical Pharmacology, Therapeutics and Prescribing: 100 Cases (3.5, nf. Layne & Ferro, CRC Press). Very short review here.
47. Learning Domain-Driven Design: Aligning Software Architecture and Business Strategy (3, nf. Vladik Khononov, O’Reilly Media. A slightly disappointing read, short review here). The page count reported on TheStoryGraph was off by almost 200 pages; on TSG the page count was set at 340 pages, but my Kindle version included 531 pages.
48. Accelerate: Building and Scaling High Performing Technology Organizations (2, nf. Humble, Kim & Forsgren, IT Revolution Press). Short review here.
49. 100 Cases in Dermatology (2.75, nf. Morris-Jones, Powell & Benton, CRC Press). Review here.
50. A Memory of Light (The Wheel of Time #14) (5, f. Robert Jordan). Review here.
51. The Staff Engineer’s Path: A Guide For Individual Contributors Navigating Growth and Change (2.5, nf. Tanya Reilly, O’Reilly Media).
52. 100 Cases in Radiology (3.5, nf. Thomas, Burke & Connelly, CRC Press).
53. The Last Devil to Die – A Thursday Murder Club Mystery #4 (5, f. Richard Osman). Short review here.
54. Oxford Handbook of Pain Management (3.25, nf. Connell, Brook & Pickering (editors), Oxford University Press).
55. The Enterprise Data Catalog (4.5, nf. Olesen-Bagneux, Ole, O’Reilly Media).
56. Yumi and the Nightmare Painter (Secret Projects #3) (4.5, f. Brandon Sanderson). Review here.
57. The Fall of Rome: And the End of Civilization (5, nf. Bryan Ward-Perkins, Oxford University Press). Review here.
The Pragmatic Programmer
I recently read this book by David Thomas & Andrew Hunt. It’s quite decent.
Some sample quotes from the book below:
…
“Programming is a craft. At its simplest, it comes down to getting a computer to do what you want it to do (or what your user wants it to do). As a programmer, you are part listener, part advisor, part interpreter, and part dictator. You try to capture elusive requirements and find a way of expressing them so that a mere machine can do them justice. You try to document your work so that others can understand it, and you try to engineer your work so that others can build on it. What’s more, you try to do all this against the relentless ticking of the project clock. You work small miracles every day.
It’s a difficult job.
There are many people offering you help. Tool vendors tout the miracles their products perform. Methodology gurus promise that their techniques guarantee results. Everyone claims that their programming language is the best, and every operating system is the answer to all conceivable ills.
Of course, none of this is true. There are no easy answers. There is no best solution, be it a tool, a language, or an operating system. There can only be systems that are more appropriate in a particular set of circumstances.
This is where pragmatism comes in. You shouldn’t be wedded to any particular technology, but have a broad enough background and experience base to allow you to choose good solutions in particular situations. […] You adjust your approach to suit the current circumstances and environment. You judge the relative importance of all the factors affecting a project and use your experience to produce appropriate solutions.”
“One of the cornerstones of the pragmatic philosophy is the idea of taking responsibility for yourself and your actions in terms of your career advancement, your learning and education, your project, and your day-to-day work. Pragmatic Programmers take charge of their own career, and aren’t afraid to admit ignorance or error. It’s not the most pleasant aspect of programming, to be sure, but it will happen — even on the best of projects. Despite thorough testing, good documentation, and solid automation, things go wrong. Deliveries are late. Unforeseen technical problems come up. These things happen, and we try to deal with them as professionally as we can. This means being honest and direct. We can be proud of our abilities, but we must own up to our shortcomings — our ignorance and our mistakes.”
“Above all, your team needs to be able to trust and rely on you — and you need to be comfortable relying on each of them as well. Trust in a team is absolutely essential for creativity and collaboration according to the research literature.[4] In a healthy environment based in trust, you can safely speak your mind, present your ideas, and rely on your team members who can in turn rely on you. Without trust, well…”
“In addition to doing your own personal best, you must analyze the situation for risks that are beyond your control. You have the right not to take on a responsibility for an impossible situation, or one in which the risks are too great […] When you do accept the responsibility for an outcome, you should expect to be held accountable for it. When you make a mistake (as we all do) or an error in judgment, admit it honestly and try to offer options. Don’t blame someone or something else, or make up an excuse. […] Instead of excuses, provide options. Don’t say it can’t be done; explain what can be done to salvage the situation.”
“The phrase “good enough’’ does not imply sloppy or poorly produced code. All systems must meet their users’ requirements to be successful […]. We are simply advocating that users be given an opportunity to participate in the process of deciding when what you’ve produced is good enough for their needs. […] The scope and quality of the system you produce should be discussed as part of that system’s requirements. […] Often you’ll be in situations where trade-offs are involved. Surprisingly, many users would rather use software with some rough edges today than wait a year for the shiny, bells-and-whistles version […] Great software today is often preferable to the fantasy of perfect software tomorrow. If you give your users something to play with early, their feedback will often lead you to a better eventual solution”.
“A good idea is an orphan without effective communication.”
“Build Documentation In, Don’t Bolt It On”.
“DRY Is More Than Code
Let’s get something out of the way up-front. In the first edition of this book we did a poor job of explaining just what we meant by Don’t Repeat Yourself [DRY]. Many people took it to refer to code only: they thought that DRY means “don’t copy-and-paste lines of source.” That is part of DRY, but it’s a tiny and fairly trivial part. DRY is about the duplication of knowledge, of intent. It’s about expressing the same thing in two different places, possibly in two totally different ways.
Here’s the acid test: when some single facet of the code has to change, do you find yourself making that change in multiple places, and in multiple different formats? Do you have to change code and documentation, or a database schema and a structure that holds it, or…? If so, your code isn’t DRY.”
“When we perform maintenance, we have to find and change the representations of things — those capsules of knowledge embedded in the application. The problem is that it’s easy to duplicate knowledge in the specifications, processes, and programs that we develop, and when we do so, we invite a maintenance nightmare […] Perhaps the hardest type of duplication to detect and handle occurs between different developers on a project. Entire sets of functionality may be inadvertently duplicated, and that duplication could go undetected for years, leading to maintenance problems.”
“At a high level, deal with the problem by building a strong, tight-knit team with good communications.
However, at the module level, the problem is more insidious. Commonly needed functionality or data that doesn’t fall into an obvious area of responsibility can get implemented many times over.
We feel that the best way to deal with this is to encourage active and frequent communication between developers.”
“What you’re trying to do is foster an environment where it’s easier to find and reuse existing stuff than to write it yourself. If it isn’t easy, people won’t do it. And if you fail to reuse, you risk duplicating knowledge.”
“Prototypes are designed to answer just a few questions, so they are much cheaper and faster to develop than applications that go into production. The code can ignore unimportant details—unimportant to you at the moment, but probably very important to the user later on. If you are prototyping a UI, for instance, you can get away with incorrect results or data.”
“What sorts of things might you choose to investigate with a prototype? Anything that carries risk. Anything that hasn’t been tried before, or that is absolutely critical to the final system. Anything unproven, experimental, or doubtful. Anything you aren’t comfortable with. You can prototype:
*Architecture
*New functionality in an existing system
*Structure or contents of external data
*Third-party tools or components
*Performance issues
*User interface design
Prototyping is a learning experience. Its value lies not in the code produced, but in the lessons learned. That’s really the point of prototyping.”
“One of the interesting things about estimating is that the units you use make a difference in the interpretation of the result. If you say that something will take about 130 working days, then people will be expecting it to come in pretty close. However, if you say “Oh, about six months,” then they know to look for it any time between five and seven months from now. […] The same concepts apply to estimates of any quantity: choose the units of your answer to reflect the accuracy you intend to convey.”
“Every time you find yourself doing something repetitive, get into the habit of thinking “there must be a better way.” Then find it.”
“All software becomes legacy software as soon as it’s written.”
“All errors give you information. You could convince yourself that the error can’t happen, and choose to ignore it. Instead, Pragmatic Programmers tell themselves that if there is an error, something very, very bad has happened. Don’t forget to Read the Damn Error Message”
“One of the benefits of detecting problems as soon as you can is that you can crash earlier, and crashing is often the best thing you can do. The alternative may be to continue, writing corrupted data to some vital database or commanding the washing machine into its twentieth consecutive spin cycle.”
“…the basic principle stays the same — when your code discovers that something that was supposed to be impossible just happened, your program is no longer viable. Anything it does from this point forward becomes suspect, so terminate it as soon as possible. A dead program normally does a lot less damage than a crippled one.”
“How to Program by Coincidence
Suppose Fred is given a programming assignment. Fred types in some code, tries it, and it seems to work. Fred types in some more code, tries it, and it still seems to work. After several weeks of coding this way, the program suddenly stops working, and after hours of trying to fix it, he still doesn’t know why. Fred may well spend a significant amount of time chasing this piece of code around without ever being able to fix it. No matter what he does, it just doesn’t ever seem to work right.
Fred doesn’t know why the code is failing because he didn’t know why it worked in the first place. It seemed to work, given the limited “testing’’ that Fred did, but that was just a coincidence.”
“Dont Program by Coincidence […] If you’re not sure why it works, you won’t know why it fails. […] Developers who don’t actively think about their code are programming by coincidence — the code might work, but there’s no particular reason why. […] Coding is not mechanical. … There are decisions to be made every minute — decisions that require careful thought and judgment if the resulting program is to enjoy a long, accurate, and productive life.”
Recreational math, a few videos
You can check out Neller & Presser’s 2004 paper which Ben refers to in the video here.
I seem to recall the box game above from when I was a child, and I think I actually tentatively reached a similar conclusion as Bradlow did in the video, namely that one of the example combinations displayed on the box did not seem to be possible to reach through any legal sequence of box manipulations/moves. One of my uncles used to be a math professor and I think we actually discussed this game at one point, but if we did it’s many years ago so details are very hazy – Bradlow’s line of reasoning sounds familiar but that may just be due to the fact that a ‘parity argument’ of the type he introduces in the video seems to often be useful in the context of implicit game theory existence proofs like these, even though we did not in fact go into such details back then.
Either way Bradlow did the math and if you encounter someone who claims he managed to solve the example discussed in the video you’ll know two things: 1. S/he cheated, and 2. s/he most likely did not do the math.
The cat and mouse game is a great illustration/example of how combining different strategies may sometimes lead to the solution of a problem that might not be solveable by any single strategy in the choice set on its own; considering combinations of different strategies will always increase the choice set, and/but sometimes it’ll do so in surprisingly unintuitive yet helpful ways.
Books 2022
I try to make a list like this every year.
Goodreads generated a view of some of the books with cover images here. I only used Goodreads for tracking my reading for part of the year, as the site stopped working for me – I became unable to add new books because of a bug, and I learned that support for such issues is non-existent; you get what you pay for, and they provided me no option to actually pay for getting this fixed so I left the site. I have switched to The StoryGraph for keeping track of the books I read, and they handle stats like these somewhat differently and they don’t generate the same kind of list. I think you also need an account on the site in order to see stats like these, I’m asked for a login when I try to access a link to my stats page for 2022 in incognito mode, so I didn’t think it made sense to share that link; however I have shared a relevant screen shot from the stats page below. The Storygraph’s rating scale is more fine-grained than that of Goodreads, but the scale is roughly similar.
The primary variable that came into focus this year for me was the page count, not the book count, because I realized in October that this might be the year where I actually had a realistic chance to manage to read 100 book pages per day on average over the course of the year, something I have never managed to do before. This was also the reason for the high number of pages read in November in particular (below). I made it with a few days to spare. The stats page on Goodreads logs the page count for the year at 13.749 pages, which is incorrect because three books had missing page counts from the book profile pages and so their page counts are not included in the total. Wolverton’s Nuclear Weapons book did not have a page count on Goodreads but my Kindle version has 268 pages, which should be added to the total, as should the 240 missing pages from The Ritual Animal: Imitation and Cohesion in the Evolution of Social Complexity and the 150 missing pages from the publication Cybersecurity. For The Storygraph I have 23.404 pages logged, distributed in this manner throughout the year:
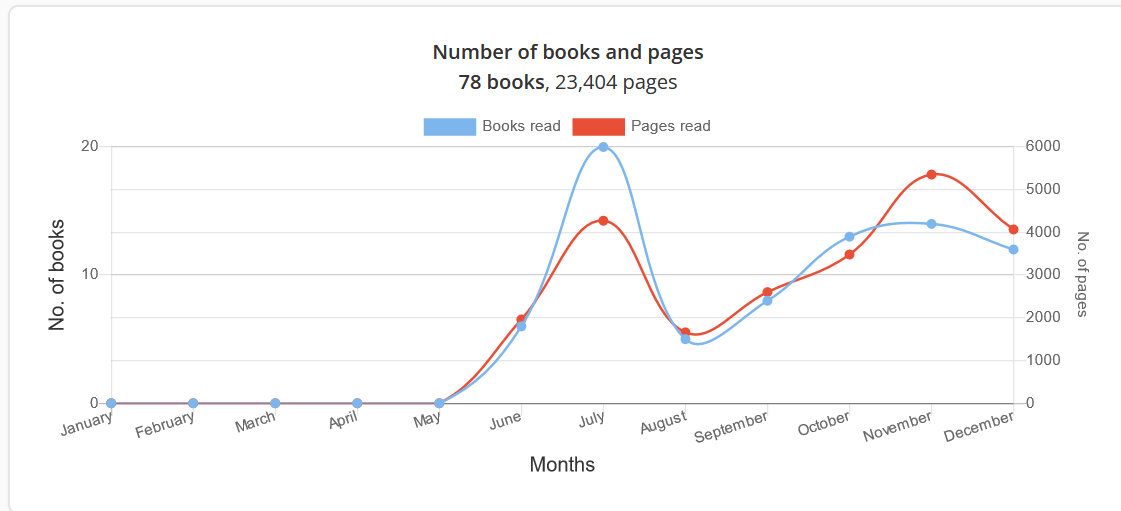
That number is however too high, as it includes 4 books I do not want to include in the count because they are Dilbert books; those 4 publications make up in total 704 pages which should be subtracted as well. There is zero overlap between the two sites – I was recorded as being in the middle of reading multiple books on Goodreads when the site stopped working, but this is irrelevant for the stats as I know that logged pages linked to books not finished are not included in the Goodreads total (they are however included in the Storygraph stats); this is something I have been annoyed about in the past. So altogether this makes the total page count equal to 13.749 + 268 + 240 + 150 + 23.404 – 704 = 37.107 pages, which is slightly more than the 36.500 cut-off which would be required in order to have reached the goal of 100 pages per day.
Until October, when I was realizing the 100-pages-per-day goal might be achievable, I don’t think I actually cared all that much about trying to find the exact edition of the specific book I was reading in contexts where many editions exist, and so in some contexts I’d assume specific page counts of the books I actually read might have been different from the page counts logged; I am aware of at least one major mismatch: Wiegers & Beatty’s Software Requirements 3 was logged as 672 pages on The Storygraph, however my own Kindle version of the book actually has 1248 pages. However I’m assuming such measurement errors should average out, so I have not added those specific ‘missing pages’ because they might be offset by other errors in the other direction elsewhere which I have not taken note of.
As for the number of books completed, the number for the year is 35 (Goodreads) + 78 (The Storygraph) – 4 (Dilbert) = 109. No unfinished books are included in that number, although I also read the first few hundred pages of the book Data Engineering with AWS during the year (…pages which, again, were not included in the total because Goodreads disregards pages linked to unfinished books), but I did not manage to finish that one due to the fact that work was taking up too much of the ‘mental surplus’ required to actually read and understand a book like that at the time, and I just never got back to it – I might do that this year. I also started reading Sanderson’s The Way of Kings at the end of the year and that book is also not featuring on the list despite contributing a few pages to the total page count.
Most of the books I read last year were fiction books, but some of the non-fiction books I read throughout the year are not easy reads and I’m reasonably satisfied with the amount of non-fiction reading I did throughout the year, although I didn’t read ‘enough’ of it towards the end of the year in particular, because (good) non-fiction takes longer to read than fiction and I sort of really wanted to hit that page count goal. In terms of the categories I have used, 20 books were non-fiction, 6 were miscellaneous (these tend to be categorized as non-fiction elsewhere, but I reserve that category for textbooks and similar – if they were to be coded as non-fiction as well then I completed one non-fiction book every second week on average over the course of the year), and 83 fiction books.
The average page count of the books I read throughout the year was ~340 pages (37.107/109), which is rather high and one of the reasons why I wasn’t really all that focused on a book count endgoal this year.
…
In the list below the numbers in the parentheses are the ratings I gave the books, and the letters following the ratings code for the book category (f = fiction, nf = non-fiction, m = miscellaneous).
Below is the list of books I read in 2022:
1 All Clear (5, f). Connie Willis. Short Goodreads review here (quote from the review: “This is one of the best books I’ve ever read”).
2. Fire Watch (2, f). Connie Willis.
3. Lincoln’s Dreams (3, f). Connie Willis. Goodreads review here.
4. Microbiology, A Very Short Introduction (4, nf. Oxford University Press)
5. The Name of the Wind (5, f). Patrick Rothfuss. My very short Goodreads review simply states: “This is an amazing book.” Recommended.
6. The Wise Man’s Fear (5, f). Patrick Rothfuss.
7. The Slow Regard of Silent Things (5, f). Patrick Rothfuss. Goodreads review here.
8. Furies of Calderon (4, f). Jim Butcher.
9. Adaptation and Natural Selection (3, nf. Princeton University Press).
10. Academ’s Fury (3, f). Jim Butcher.
11. Cursor’s Fury (3, f). Jim Butcher.
12. Captain’s Fury (3, f). Jim Butcher.
13. Princeps’ Fury (2, f). Jim Butcher.
14. The Missing Readme: A Guide for the New Software Engineer (4, nf. No Starch Press). Work-related.
15. The Great Troll War (3, f). Jasper Fforde. Short Goodreads review here.
16. First Lord’s Fury (2, f). Jim Butcher.
17. Introduction to PLCs (2, nf. Carolina Academic Press). Short Goodreads review here.
18. The Metamorphosis (1, f). Franz Kafka. My very short Goodreads review simply stated: “Boring and implausible.”
19. The Thursday Murder Club (4, f). Richard Osman.
20. The Man Who Died Twice (5, f). Richard Osman.
21. 97 Things Every Data Engineer Should Know (2, nf. O’Reilly Media). Work-related. Goodreads review here.
22. Magpie Murders (4, f). Anthony Horowitz.
23. Moonflower Murders (3, f). Anthony Horowitz.
24. The Word Is Murder (5, f). Anthony Horowitz. Short Goodreads review here.
25. The Sentence is Death (4, f). Anthony Horowitz. Very short goodreads review here.
26. A Line To Kill (4, f). Anthony Horowitz. Very short goodreads review here.
27. The House of Silk (2, f). Anthony Horowitz.
28. Moriarty (4, f). Anthony Horowitz.
29. Nuclear Weapons (4, nf. Princeton University Press). Very short Goodreads review here.
30. The Goblin Emperor (5, f). Very short Goodreads review here.
31. The Ritual Animal: Imitation and Cohesion in the Evolution of Social Complexity (2, nf. Oxford University Press). A mixed bag, as I wrote in my Goodreads review here.
32. Supernova (4, nf. Princeton University Press). In my Goodreads review I called the book ‘A nice little primer on this topic’.
33. The Witness for the Dead (3, f). Goodreads review here.
34. Cybersecurity (2, nf. Princeton University Press). Not really coverage at a level deep enough for this to be particularly useful in my position, but I did grab it in part for work-related reasons (wanting to know if this might be an easy primer it would make sense to recommend to some colleagues at work).
35. The Angel of the Crows (2, f). Katherine Addison. Short Goodreads review here.
36. The Grief of Stones (2,25, f). Katherine Addison.
37. What Patients Say, What Doctors Hear (1,5, nf. Beacon Press)
38. The Man With a Load of Mischief (2, f). Martha Grimes.
39. Death Of An Old Goat (4,5, f). Robert Barnard. Short review here.
40. A Little Local Murder (4,25, f). Robert Barnard.
41. Death on the High C’s (2,25, f). Robert Barnard. Short review here.
42. The History of Time: A Very Short Introduction (1,25, nf. Oxford University Press). Short review here.
43. Blood Brotherhood (2, f). Robert Barnard.
44. Unruly Son (4, f). Robert Barnard.
45. Posthumous Papers (2,25, f). Robert Barnard.
46. Death In A Cold Climate (3,5, f). Robert Barnard. Review here.
47. Mother’s Boys (4,25, f). Robert Barnard. Very short review here.
48. Little Victims (4, f). Robert Barnard.
49. Out of the Blackout (2, f). Robert Barnard.
50. Corpse In A Gilded Cage (4,5, f). Robert Barnard. Very short review here.
51. The Disposal of the Living (2, f). Robert Barnard. Short review here.
52. Political Suicide (4,25, f). Robert Barnard.
53. The Skeleton in the Grass (3,5, f). Robert Barnard.
54. At Death’s Door (f). Robert Barnard.
55. A City Of Strangers (0,0, f). Robert Barnard. Review here.
56. Designing Data-Intensive Applications (5, nf. O’Reilly Media). I would probably have added this book to my list of favorite books on Goodreads if I had still been using Goodreads at that point in time. This book is loong (1052 pages), but it’s full of good stuff. I have been sharing information from this book with colleagues in my team. The book is a big part of the reason why the 10+ books above it on this list were all fiction books – it wasn’t that I wasn’t reading any non-fiction during that period, but rather that this book takes a lot of time to read and understand.
57. The Masters of the House (3, f). Robert Barnard.
58. Death and the Chaste Apprentice (2,25, f). Robert Barnard.
59. A Fatal Attachment (2, f). Robert Barnard.
60. A Hovering Of Vultures (1,5, f). Robert Barnard.
61. Unholy Dying (2, f). Robert Barnard.
62. Mort (5, f). Terry Pratchett.
63. The Law (4, f). Jim Butcher.
64. Touched by the Dead (1,75, f). Robert Barnard.
65. With the Old Breed: At Peleliu and Okinawa (5, nf. Oxford University Press). Eugene Sledge’s book is very much worth reading if you’re interested in WW2 war memoirs.
66. Getting to Yes: Negotiating Agreement Without Giving In (3,5, nf. Penguin Group). Review here.
67. Software Requirements 3 (5, nf. Microsoft Press). Review here. Work-related. I would have added this book to my list of favorite books on Goodreads if I had still been using Goodreads. This was the only book I blogged last year, blogpost here.
68. What If? 2: Additional Serious Scientific Answers to Absurd Hypothetical Questions (5, m.). Very short review here.
69. A Confederacy of Dunces (2,25, f). John Kennedy Toole. Review here.
70. Troy (3, m.). Stephen Fry. Review here.
71. How to: Absurd Scientific Advice for Common Real-World Problems (4, m.). Randall Munroe.
72. The Bullet That Missed (4,5, f). Richard Osman.
73. Still Life (3,5, f). Louise Penny.
74. Biofabrication (2,75, nf. MIT Press).
75. A Fatal Grace (2,25, f). Louise Penny.
76. The Cruelest Month (1,25, f). Louise Penny.
77. Hunting: A Cultural History (1, nf. MIT Press). Review here.
78. How to Take Over the World: Practical Schemes and Scientific Solutions for the Aspiring Supervillain (3,5, m.). This book is quite funny and I recommended it to a colleague who happens to be a Marvel fan.
79. Humble Pi: A Comedy of Maths Errors (5, m.). Matt Parker. Very short review here.
80. Neurolinguistics (4,5, nf. MIT Press). I think I recommended this one to one of my brothers and one or two colleagues, it’s a very nice little book.
81. Death and Croissants (4,5, f). Ian Moore.
82. Death and Fromage (4,5, f). Ian Moore. Very short review here.
83. Death and Papa Noël (3, f). Ian Moore.
84. Forever and a Day (2, f). Anthony Horowitz. Short review here.
85. With a Mind to Kill (2, f). Anthony Horowitz. Short review here.
86. Trigger Mortis (2, f). Anthony Horowitz.
87. Casino Royale (2, f). Ian Fleming.
88. Live and Let Die (2, f). Ian Fleming.
89. Moonraker (2, f). Ian Fleming.
90. Diamonds Are Forever (2,25, f). Ian Fleming.
91. From Russia With Love (2, f). Ian Fleming.
92. Dr No (2,5, f). Ian Fleming.
93. Rethinking Human Evolution (3, nf. MIT Press). Review here.
94. Zero Minus Ten (1,75, f). Raymond Benson.
95. The Facts of Death (2, f). Raymond Benson. Very short review here.
96. The Final Empire (5, f). Brandon Sanderson. Very short review here.
97. The Well of Ascension (5, f). Brandon Sanderson. Review here.
98. Code That Fits in Your Head: Heuristics for Software Engineering (3, nf, Addison-Wesley Professional). Work-related, I shared insights from this book with some of my colleagues.
99. The Hero of Ages (4, f). Brandon Sanderson.
100. The Alloy of Law (5, f). Brandon Sanderson. Very short review here.
101. Shadows of Self: A Mistborn Novel (5, f). Brandon Sanderson. Very short review here.
102. The Bands of Mourning (5, f). Brandon Sanderson.
103. Mistborn: Secret History (2,25, f). Brandon Sanderson. Short review here.
104. The Lost Metal (4,5, f). Brandon Sanderson.
105. Elantris (5, f). Brandon Sanderson. Short review here.
106. The Emperor’s Soul (4, f). Brandon Sanderson. Review here.
107. High Time to Kill (1, f). Raymond Benson.
108. Intellectual Property Strategy (1,5, nf. MIT Press). Review here.
109. The Journal of Nicholas Cresswell, 1774-1777 (m.). Review here.
Software requirements
I’m currently reading this book. Some learnings and quotes from the first third of it below (I’m slightly confused if the linked version is exactly the same version as the one I’m reading, as the Kindle version I’m reading includes 1252 pages and the page count of the above book is approximately half of that, but that may just be a Kindle thing). I really like the book, it includes a lot of good stuff, though the amount of coverage dedicated to implementing good requirements practices in an agile setting leaves a little to be desired, at least so far.
…
“Many problems in the software world arise from shortcomings in the ways that people learn about, document, agree upon and modify the product’s requirements. […] common problem areas are informal information gathering, implied functionality, miscommunicated assumptions, poorly specified requirements, and a casual change process.
Various studies suggest that errors introduced during requirements activities account for 40 to 50 percent of all defects found in a software product […]. Inadequate user input and shortcomings in specifying and managing customer requirements are major contributors to unsuccessful projects. Despite this evidence, many organizations still practice ineffective requirements methods. Nowhere more than in the requirements do the interests of all the stakeholders in a project intersect. […] stakeholders include customers, users, business analysts, developers, and many others. Handled well, this intersection can lead to delighted customers and fulfilled developers. Handled poorly, it’s the source of misunderstanding and friction that undermine the product’s quality and business value.”
“The goal of requirements development is to accumulate a set of requirements that are good enough to allow your team to proceed with design and construction of the next portion of the product at an acceptable level of risk. You need to devote enough attention to requirements to minimize the risks of rework, unacceptable products, and blown schedules.”
“You will never get perfect requirements. […] The amount of detail, the kinds of information you provide, and the way you organize it should all be intended to meet the needs of your audiences. […] On most projects it’s neither realistic nor necessary to pin down every requirement detail early in the project. Instead, think in terms of layers. You need to learn just enough about the requirements to be able to roughly prioritize them and allocate them to forthcoming releases or iterations. Then you can detail groups of requirements in a just-in-time fashion to give developers enough information so they can avoid excessive and unnecessary rework.”
“Reaching agreement on external and internal system interfaces has been identified as a software industry best practice […]. A complex system with multiple subcomponents should create a separate interface specification or system architecture specification. […] A change in an interface demands communication with the person, group, or system on the other side of that interface.”
There are many types of requirements:
“Software requirements include three distinct levels: business requirements, user requirements, and functional requirements. In addition, every system has an assortment of nonfunctional requirements. […] What you call each deliverable is less important than having your organization agree on their names, what kinds of information go into each, and how that information is organized.”
Business requirements describe why the organization is implementing the system — the business benefits the organization hopes to achieve.
User requirements describe goals or tasks the users must be able to perform with the product that will provide value to someone. […] [they] describe what the user will be able to do with the system. An example of a use case is “Check in for a flight” using an airline’s website.
Functional requirements specify the behaviors the product will exhibit under specific conditions. They describe what the developers must implement to enable users to accomplish their tasks (user requirements), thereby satisfying the business requirements. [They] often are written in the form of the traditional “shall” statements: “The Passenger shall be able to print boarding passes for all flight segments for which he has checked in”.
System requirements describe the requirements for a product that is composed of multiple components or subsystems.
A good example of a “system” is the cashier’s workstation in a supermarket. There’s a bar code scanner integrated with a scale, as well as a hand-held bar code scanner. The cashier has a keyboard, a display, and a cash drawer. […] These hardware devices are all interacting under software control. The requirements for the system or product as a whole, then, lead the business analyst to derive specific functionality that must be allocated to one or another of those component subsystems, as well as demanding an understanding of the interfaces between them.
Business rules include corporate policies, government regulations, industry standards, and computational algorithms.
[They] are not themselves software requirements because they have an existence beyond the boundaries of any specific software application. However, they often dictate that the system must contain functionality to comply with the pertinent rules.
Non-functional requirements might specify not what the system does, but how well it does it.
Some people consider nonfunctional requirements to be synonymous with quality attributes, but design and implementation constraints are also considered nonfunctional requirements, as are external interface requirements.
Quality requirements should be specific, quantitative, and verifiable. It is recommended that the relative priorities of various such attributes, such as ease of use vs. ease of learning, or security vs. performance, is specified by the people who request the attributes in question.
You can deliver a product that has all the desired functionality but that users hate because it doesn’t match their (often unstated) quality expectations.
A feature consists of one or more logically related system capabilities that provide value to a user and are described by a set of functional requirements.
…
“The best way to tell whether your requirements possess these desired attributes is to have several stakeholders review them. Different stakeholders will spot different kinds of problems.” (p. 378)
…
Project requirements are different from product requirements. In this context, the above requirement components were product requirements. Project requirements include components like:
*Physical resources used by the development team (e.g. hardware), rooms, etc.
*Staff training needs
*User documentation, including training materials
*Support documentation
*Requirements and procedures for releasing the product, installing it in the operating environment, configuring it, and testing the installation. (Implementation plan)
*SLAs
*Intellectual property-related requirements
…
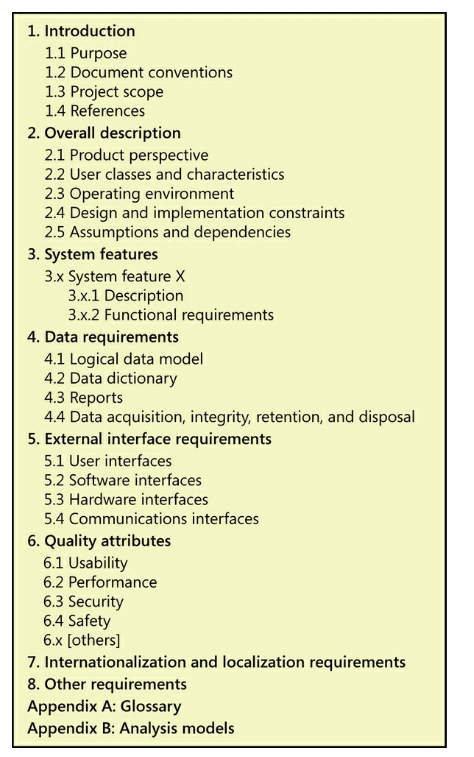
A template for stuff you may want to address:
Code Complete (I)
Here’s what I wrote about the book elsewhere not long ago: “I recently started reading the book Code Complete by Steve McConnell. I’ve only read the first 100 pages so far (Kindle estimate of time remaining: 27 hours… – then again, it is 960 pages..) but I can already confidently say at this point that if you’re a software developer or programmer or similar, or plan to be, then you’ll want to read this book – it’s awesome. (…and even just reading the first 50 pages of this book would probably make you a better programmer, even if you read no more than that…)”
I enjoy reading it and I learn something new on many of the pages here, or perhaps get a new angle on a topic I have familiarity with – I’ve already come across multiple important insights that I’d really wish I’d have known about when involved in projects in the past, and I’m trying to share some of these learnings also with my coworkers. It’s just a good book. The fact that it’s already almost 20 years old of course means that there isn’t a great deal of coverage about, say, the topics touched upon in the lecture below this post, but a lot of this stuff is about fundamentals, concepts, and tradeoffs, which means that this aspect actually matters probably significantly less than you’d think. Not all suggestions made are the sort of suggestions I feel tempted to immediately follow/implement in my daily work, but most of them at the very least makes you think a bit more about the choices you might be making, often subconsciously – and as the quotes below should incidentally serve to illustrate it’s not just a book about coding.
I have added some sample quotes from the chapters I’ve read so far below.
…
“Construction is a large part of software development. Depending on the size of the project, construction typically takes 30 to 80 percent of the total time spent on a project. […] Construction is the central activity in software development. Requirements and architecture are done before construction so that you can do construction effectively. System testing (in the strict sense of independent testing) is done after construction to verify that construction has been done correctly. […] With a focus on construction, the individual programmer’s productivity can improve enormously. A classic study by Sackman, Erikson, and Grant showed that the productivity of individual programmers varied by a factor of 10 to 20 during construction (1968). Since their study, their results have been confirmed by numerous other studies (Curtis 1981, Mills 1983, Curtis et al. 1986, Card 1987, Valett and McGarry 1989, DeMarco and Lister 1999, Boehm et al. 2000). This book helps all programmers learn techniques that are already used by the best programmers.”
“As much as 90 percent of the development effort on a typical software system comes after its initial release, with two-thirds being typical (Pigoski, 1997).”
“It generally doesn’t make sense to code things you can buy ready-made.”
“Choosing the right tool for each problem is one key to being an effective programmer.”
“Good architecture makes construction easy. Bad architecture makes construction almost impossible.”
“Good software architecture is largely machine- and language-independent.”
“Part of a programmer’s job is to educate bosses and coworkers about the software-development process, including the importance of adequate preparation before programming begins.”
“Both building construction and software construction benefit from appropriate levels of planning. If you build software in the wrong order, it’s hard to code, hard to test, and hard to debug. It can take longer to complete, or the project can fall apart because everyone’s work is too complex and therefore too confusing when it’s all combined. Careful planning doesn’t necessarily mean exhaustive planning or over-planning. You can plan out the structural supports and decide later whether to put in hardwood floors or carpeting, what color to paint the walls, what roofing material to use, and so on. A well-planned project improves your ability to change your mind later about details. The more experience you have with the kind of software you’re building, the more details you can take for granted. You just want to be sure that you plan enough so that lack of planning doesn’t create major problems later.”
“The overarching goal of preparation is risk reduction: a good project planner clears major risks out of the way as early as possible so that the bulk of the project can proceed as smoothly as possible. By far the most common project risks in software development are poor requirements and poor project planning […] You might think that all professional programmers know about the importance of preparation and check that the prerequisites have been satisfied before jumping into construction. Unfortunately, that isn’t so. A common cause of incomplete preparation is that the developers who are assigned to work on the upstream activities do not have the expertise to carry out their assignments. The skills needed to plan a project, create a compelling business case, develop comprehensive and accurate requirements, and create high-quality architectures are far from trivial, but most developers have not received training in how to perform these activities. […] Some programmers do know how to perform upstream activities, but they don’t prepare because they can’t resist the urge to begin coding as soon as possible. […] It takes only a few large programs to learn that you can avoid a lot of stress by planning ahead. Let your own experience be your guide. A final reason that programmers don’t prepare is that managers are notoriously unsympathetic to programmers who spend time on construction prerequisites.”
“One of the key ideas in effective programming is that preparation is important. It makes sense that before you start working on a big project, you should plan the project. Big projects require more planning; small projects require less. […] Researchers at Hewlett-Packard, IBM, Hughes Aircraft, TRW, and other organizations have found that purging an error by the beginning of construction allows rework to be done 10 to 100 times less expensively than when it’s done in the last part of the process, during system test or after release […]. In general, the principle is to find an error as close as possible to the time at which it was introduced. The longer the defect stays in the software food chain, the more damage it causes further down the chain. Since requirements are done first, requirements defects have the potential to be in the system longer and to be more expensive. Defects inserted into the software upstream also tend to have broader effects than those inserted further downstream. That also makes early defects more expensive. […] for example, an architecture defect that costs $1000 to fix when the architecture is being created can cost $15,000 to fix during system test. […] The cost to fix a defect rises dramatically as the time from when it’s introduced to when it’s detected increases. This remains true whether the project is highly sequential (doing 100 percent of requirements and design up front) or highly iterative (doing 5 percent of requirements and design up front). […] Dozens of companies have found that simply focusing on correcting defects earlier rather than later in a project can cut development costs and schedules by factors of two or more […]. This is a healthy incentive to find and fix your problems as early as you can.”
“Accommodating changes is one of the most challenging aspects of good program design. The goal is to isolate unstable areas so that the effect of a change will be limited to one routine, class, or package. […] Business rules tend to be the source of frequent software changes. […] Business systems projects tend to benefit from highly iterative approaches, in which planning, requirements, and architecture are interleaved with construction, system testing, and quality-assurance activities. […] Iterative approaches tend to reduce the impact of inadequate upstream work, but they don’t eliminate it. […] Iterative approaches are usually a better option for many reasons, but an iterative approach that ignores prerequisites can end up costing significantly more than a sequential project that pays close attention to prerequisites. […] One common rule of thumb is to plan to specify about 80 percent of the requirements up front, allocate time for additional requirements to be specified later, and then practice systematic change control to accept only the most valuable new requirements as the project progresses. Another alternative is to specify only the most important 20 percent of the requirements up front and plan to develop the rest of the software in small increments, specifying additional requirements and designs as you go. […] One key to successful construction is understanding the degree to which prerequisites have been completed and adjusting your approach accordingly […] The extent to which prerequisites need to be satisfied up front will vary with the project type […], project formality, technical environment, staff capabilities, and project business goals. […] Software being what it is, iterative approaches are useful much more often than sequential approaches are. […] Some projects do too much up front; they doggedly adhere to requirements and plans that have been invalidated by down-stream discoveries, and that can also impede progress during construction.”
“[D]ata from numerous organizations indicates that on large projects an error in requirements detected during the architecture stage is typically 3 times as expensive to correct as it would be if it were detected during the requirements stage. If detected during coding, it’s 5–10 times as expensive; during system test, 10 times; and post-release, a whopping 10–100 times as expensive as it would be if it were detected during requirements development. On smaller projects with lower administrative costs, the multiplier post-release is closer to 5–10 than 100 (Boehm and Turner 2004). […] Specifying requirements adequately is a key to project success, perhaps even more important than effective construction techniques. […] Stable requirements are the holy grail of software development. With stable requirements, a project can proceed from architecture to design to coding to testing in a way that’s orderly, predictable, and calm. […] It’s fine to hope that once your customer has accepted a requirements document, no changes will be needed. On a typical project, however, the customer can’t reliably describe what is needed before the code is written. The problem isn’t that the customers are a lower life form. Just as the more you work with the project, the better you understand it, the more they work with it, the better they understand it. The development process helps customers better understand their own needs, and this is a major source of requirements changes […]. A plan to follow the requirements rigidly is actually a plan not to respond to your customer. How much change is typical? Studies at IBM and other companies have found that the average project experiences about a 25 percent change in requirements during development […], which accounts for 70 to 85 percent of the rework on a typical project […] Make sure everyone knows the cost of requirements changes. […] say, “Gee, that sounds like a great idea. Since it’s not in the requirements document, I’ll work up a revised schedule and cost estimate so that you can decide whether you want to do it now or later.” The words “schedule” and “cost” are more sobering than coffee and a cold shower […] Set up a change-control procedure. […] Having a built-in procedure for controlling changes makes everyone happy. You’re happy because you know that you’ll have to work with changes only at specific times. Your customers are happy because they know that you have a plan for handling their input.””Use development approaches that accommodate changes. Some development approaches maximize your ability to respond to changing requirements. An evolutionary prototyping approach helps you explore a system’s requirements before you send your forces in to build it. Evolutionary delivery is an approach that delivers the system in stages. You can build a little, get a little feedback from your users, adjust your design a little, make a few changes, and build a little more. The key is using short development cycles so that you can respond to your users quickly. […] Keep your eye on the business case for the project. Many requirements issues disappear before your eyes when you refer back to the business reason for doing the project. Requirements that seemed like good ideas when considered as “features” can seem like terrible ideas when you evaluate the “incremental business value.””
“The amount of time to spend on problem definition, requirements, and software architecture varies according to the needs of your project. Generally, a well-run project devotes about 10 to 20 percent of its effort and about 20 to 30 percent of its schedule to requirements, architecture, and up-front planning […]. These figures don’t include time for detailed design—that’s part of construction. […] If requirements are unstable and you’re working on a small, informal project, you’ll probably need to resolve requirements issues yourself. Allow time for defining the requirements well enough that their volatility will have a minimal impact on construction. If the requirements are unstable on any project — formal or informal — treat requirements work as its own project. Estimate the time for the rest of the project after you’ve finished the requirements. This is a sensible approach since no one can reasonably expect you to estimate your schedule before you know what you’re building. It’s as if you were a contractor called to work on a house. Your customer says, “What will it cost to do the work?” You reasonably ask, “What do you want me to do?” Your customer says, “I can’t tell you, but how much will it cost?” You reasonably thank the customer for wasting your time and go home.”
“When software-project surveys report causes of project failure, they rarely identify technical reasons as the primary causes of project failure. Projects fail most often because of poor requirements, poor planning, or poor management. But when projects do fail for reasons that are primarily technical, the reason is often uncontrolled complexity. The software is allowed to grow so complex that no one really knows what it does. When a project reaches the point at which no one completely understands the impact that code changes in one area will have on other areas, progress grinds to a halt. […] Managing complexity is the most important technical topic in software development. In my view, it’s so important that Software’s Primary Technical Imperative has to be managing complexity. […] The goal is to minimize the amount of a program you have to think about at any one time. […] The goal of all software-design techniques is to break a complicated problem into simple pieces. The more independent the subsystems are, the more you make it safe to focus on one bit of complexity at a time. Carefully defined objects separate concerns so that you can focus on one thing at a time. Packages provide the same benefit at a higher level of aggregation. Keeping routines short helps reduce your mental workload. Writing programs in terms of the problem domain, rather than in terms of low-level implementation details, and working at the highest level of abstraction reduce the load on your brain. The bottom line is that programmers who compensate for inherent human limitations write code that’s easier for themselves and others to understand and that has fewer errors. […] Once you understand that all other technical goals in software are secondary to managing complexity, many design considerations become straightforward.”
Imitation Games – Avi Wigderson
…
If you wish to skip the introduction the talk starts at 5.20. The talk itself lasts roughly an hour, with the last ca. 20 minutes devoted to Q&A – that part is worth watching as well.
Some links related to the talk below:
Theory of computation.
Turing test.
COMPUTING MACHINERY AND INTELLIGENCE.
Probabilistic encryption & how to play mental poker keeping secret all partial information Goldwasser-Micali82.
Probabilistic algorithm
How To Generate Cryptographically Strong Sequences Of Pseudo-Random Bits (Blum&Micali, 1984)
Randomness extractor
Dense graph
Periodic sequence
Extremal graph theory
Szemerédi’s theorem
Green–Tao theorem
Szemerédi regularity lemma
New Proofs of the Green-Tao-Ziegler Dense Model Theorem: An Exposition
Calibrating Noise to Sensitivity in Private Data Analysis
Generalization in Adaptive Data Analysis and Holdout Reuse
Book: Math and Computation | Avi Wigderson
One-way function
Lattice-based cryptography
Books 2021
Last year I failed to track my reading throughout the year on goodreads, but this year I managed reasonably well – here’s an auto-generated list with cover images from goodreads.
If I had to pick out any of the books on the list as ‘must-reads’, it’d be #4 and the last two books included, in combination with the first book I read in 2022. The last part of the list looks full of fiction books and zero non-fiction but this is not a true picture of my reading patterns in November and December; Code Complete probably represents 50 hours of work alone. Worth every second: Read it!
…
1. Thinking in Systems: A Primer (2, nf. Chelsea Green Publishing). Goodreads review here.
2. Open Access (3, nf. MIT Press)
3. The Parasitic Mind: How Infectious Ideas Are Killing Common Sense (nf., Regnery Publishing).
4. Algorithms To Live By: The Computer Science of Human Decisions (5, nf. William Collins). Blog coverage here. I added this book to my list of favorite books on goodreads.
5. How to Have Impossible Conversations: A Very Practical Guide (nf., Da Capo Lifelong Books). Goodreads review here.
6. Spaceflight: A Concise History (3, nf. MIT Press)
7. Information and the Modern Corporation (2, nf. MIT Press)
8. Difficult Conversations: How to Discuss What Matters Most (5, nf. Penguin Books). I added this book to my list of favorite books on goodreads.
9. Understanding Beliefs (2, nf. MIT Press)
10. The Holy Roman Empire: A Very Short Introduction (3, nf. Oxford University Press)
11. The Habsburg Empire: A Very Short Introduction (2, nf. Oxford University Press)
12. Night Watch (5, f. Terry Pratchett). This book is on my list of favorite books on goodreads for a reason. A wonderful book, in my opinion perhaps the best book Terry Pratchett ever wrote.
13. Interesting Times (4, f. Terry Pratchett).
14. Moving Pictures (3, f. Terry Pratchett).
15. Against the Grain: A Deep History of the Earliest States (5, nf. Yale University Press). I added this book to my list of favorite books on goodreads.
16. Machine Translation (3, nf. MIT University Press).
17. Clinical Psychology: A Very Short Introduction (1, nf. Oxford University Press). Goodreads review here.
18. Handbook on the Neuropsychology of Aging and Dementia (5, nf. Springer). Short goodreads review here. I added this book to my list of favorite books on goodreads).
19. Human Anatomy: A Very Short Introduction (3, nf. Oxford University Press)
20. Seeing Like a State: How Certain Schemes to Improve the Human Condition Have Failed (3, nf. Yale University Press). Quotes from the book are included in this blog-post.
21. Ancient Warfare (2, nf. Oxford University Press)
22. Not Born Yesterday: The Science of Who We Trust and What We Believe (3, nf. Princeton University Press)
23. Exit, voice, and loyalty (4, nf.). Quotes from the book are included in this blog-post.
24. The Napoleonic Wars: A Very Short Introduction (2, nf. Oxford University Press).
25. Decision Making under Deep Uncertainty: From Theory to Practice (3, nf. Springer).
26. Private Truths, Public Lies: The Social Consequences of Preference Falsification (5, nf. Harvard University Press). Goodreads review here. I added this book to my list of favorite books on goodreads. Some quotes from the book are included in this blog-post.
27. Data Pipelines Pocket Reference: Moving and Processing Data for Analytics (3, nf. O’Reilly Media).
28. The Adventures of Sally (4, f). P. G. Wodehouse.
29. The Inimitable Jeeves (4, f). P. G. Wodehouse.
30. Blandings Castle …and Elsewhere (5, f). P. G. Wodehouse.
31. Summer Lightning (5, f). P. G. Wodehouse.
32. Thank You, Jeeves (5, f). P. G. Wodehouse.
33. The Code of the Woosters (4, f). P. G. Wodehouse.
34. Right Ho, Jeeves (5, f). P. G. Wodehouse.
35. A Damsel in Distress (3, f). P. G. Wodehouse.
36. Carry On, Jeeves (5, f). P. G. Wodehouse.
37. Very Good, Jeeves! (4, f). P. G. Wodehouse.
38. Hot Water (5, f). P. G. Wodehouse.
39. Volcanoes: A Very Short Introduction (3, nf. Oxford University Press).
40. Jeeves in the Offing (4, f). P. G. Wodehouse.
41. Jeeves and the Feudal Spirit (4, f). P. G. Wodehouse.
42. Leave It to Psmith (5, f). P. G. Wodehouse.
43. Psmith in the City (3, f). P. G. Wodehouse.
44. Psmith, Journalist (3, f). P. G. Wodehouse.
45. Data Science on AWS: Implementing End-to-End, Continuous AI and Machine Learning Pipelines (nf. O’Reilly Media). Long, code-heavy, not an easy read. Very short goodreads review here.
46. Plague: A Very Short Introduction (2, nf. Oxford University Press). Very short goodreads review here.
47. Lord Edgeware Dies (5, f). Agatha Christie.
48. Enzymes: A Very Short Introduction (5, nf. Oxford University Press). Short goodreads review here.
49. After the Funeral (4, f). Agatha Christie.
50. Soft Matter: A Very Short Introduction (3, nf. Oxford University Press).
51. Poirot Investigates (f). Agatha Christie. A mixed bag.
52. Systems Biology: A Very Short Introduction (3, nf. Oxford University Press).
53. Biogeography: A Very Short Introduction (3, nf. Oxford University Press).
54. Why Didn’t They Ask Evans? (2, f). Agatha Christie.
55. Forests: A Very Short Introduction (2, nf. Oxford University Press).
56. Cat Among the Pigeons (2, f). Agatha Christie. Old goodreads review here, written after I first read this book – after finishing the book this year I downgraded the goodreads rating from 3 stars to 2.
57. One, Two, Buckle My Shoe (4,f). Agatha Christie.
58. The A.B.C. Murders (f). Agatha Christie.
59. Death in the Clouds (4, f). Agatha Christie.
60. Assessment and Treatment of Older Adults: A Guide for Mental Health Professionals (2, nf. American Psychological Association).
61. Evil Under the Sun (4, f). Agatha Christie.
62. Cards on the Table (5, f). Agatha Christie.
63. Synthetic biology (3, nf.) Oxford University Press.
64. Five Little Pigs (4, f). Agatha Christie.
65. Data Governance: The Definitive Guide: People, Processes, and Tools to Operationalize Data Trustworthiness (3, nf. O’Reilly Media). Work-related.
66. Endless Night (3, f). Agatha Christie. Goodreads review here.
67. Peril at End House (4, f). Agatha Christie.
68. 4:50 from Paddington (3, f). Agatha Christie.
69. Murder in the Mews: Four Cases of Hercule Poirot (2, f). Agatha Christie.
70. At Bertram’s Hotel (3, f). Agatha Christie.
71. The Body in the Library (3, f). Agatha Christie.
72. Murder at the Vicarage (2, f). Agatha Christie.
73. The Moving Finger (2, f). Agatha Christie.
74. Sad Cypress (4, f). Agatha Christie.
75. The Thirteen Problems (2, f). Agatha Christie. I stand by the very short review I wrote in 2016.
76. The Hollow (4, f). Agatha Christie.
77. PLC Programming (2, nf). Nathan Clarke.
78. The Clocks (3, f). Agatha Christie.
79. Murder on the Orient Express (5, f). Agatha Christie.
80. Murder in Mesopotamia (4, f).
81. Dumb Witness (4, f). Agatha Christie. Very short goodreads review here.
82. Taken at the Flood (4, f). Agatha Christie.
83. Appointment with Death (3, f). Agatha Christie.
84. Hercule Poirot’s Christmas (5, f). Agatha Christie.
85. Death on the Nile (4, f). Agatha Christie. Updated (short) goodreads review here.
86. A Murder is Announced (2, f). Agatha Christie.
87. Black Coffee (2, f). Agatha Christie.
88. A Pocket Full of Rye (4, f). Agatha Christie.
89. The Mysterious Affair At Styles (3, f). Agatha Christie.
90. Blackout (5, f). Connie Willis. When I first read this book I gave it 5 stars but did not add it to my list of favorite books on goodreads. This was a grave mistake. This year I added the book to the list and wrote a new goodreads review, which included this observation: “my current assessment of the book is simply this: This book is one of the best books I’ve ever read.” I repeated this statement in my review of All Clear when I finished the latter book early in 2022. You need to read these books before you die.
91. Code Complete 2 (nf. 5, Microsoft Press). This book is the sole reason why I only read one non-fiction book in the last 6 weeks of 2021, and why there are so many fiction books in a row on this list towards the end of the year – it’s a 960 page book on coding/programming. It’s looong, it takes a lot of work to finish this book. But it’s so worth it – the book is by far the best book I’ve ever read on these topics. I added the book to my list of favorite books on goodreads and would strongly recommend the book to anyone who’s even thinking of working in the fields of programming/coding/software development/… Blog coverage here.
Quotes
- “Originally, I set out to understand why the state has always seemed to be the enemy of “people who move around,” to put it crudely. […] Nomads and pastoralists (such as Berbers and Bedouins), hunter-gatherers, Gypsies, vagrants, homeless people, itinerants, runaway slaves, and serfs have always been a thorn in the side of states. Efforts to permanently settle these mobile peoples (sedentarization) seemed to be a perennial state project—perennial, in part, because it so seldom succeeded. The more I examined these efforts at sedentarization, the more I came to see them as a state’s attempt to make a society legible, to arrange the population in ways that simplified the classic state functions of taxation, conscription, and prevention of rebellion. Having begun to think in these terms, I began to see legibility as a central problem in statecraft. […] much of early modern European statecraft seemed […] devoted to rationalizing and standardizing what was a social hieroglyph into a legible and administratively more convenient format. The social simplifications thus introduced not only permitted a more finely tuned system of taxation and conscription but also greatly enhanced state capacity. […] These state simplifications, the basic givens of modern statecraft, were, I began to realize, rather like abridged maps. They did not successfully represent the actual activity of the society they depicted, nor were they intended to; they represented only that slice of it that interested the official observer. They were, moreover, not just maps. Rather, they were maps that, when allied with state power, would enable much of the reality they depicted to be remade. Thus a state cadastral map created to designate taxable property-holders does not merely describe a system of land tenure; it creates such a system through its ability to give its categories the force of law.” (James C. Scott, Seeing Like a State, pp.1-2)
- “No cynicism or mendacity need be involved. It is perfectly natural for leaders and generals to exaggerate their influence on events; that is the way the world looks from where they sit, and it is rarely in the interest of their subordinates to contradict their picture.” (-ll-, p.160)
- “Old-growth forests, polycropping, and agriculture with open-pollinated landraces may not be as productive, in the short run, as single-species forests and fields or identical hybrids. But they are demonstrably more stable, more self-sufficient, and less vulnerable to epidemics and environmental stress, needing far less in the way of external infusions to keep them on track. Every time we replace “natural capital” (such as wild fish stocks or old-growth forests) with what might be called “cultivated natural capital” (such as fish farms or tree plantations), we gain in ease of appropriation and in immediate productivity, but at the cost of more maintenance expenses and less “redundancy, resiliency, and stability.”[14] If the environmental challenges faced by such systems are both modest and predictable, then a certain simplification might also be relatively stable.[15] Other things being equal, however, the less diverse the cultivated natural capital, the more vulnerable and nonsustainable it becomes. The problem is that in most economic systems, the external costs (in water or air pollution, for example, or the exhaustion of nonrenewable resources, including a reduction in biodiversity) accumulate long before the activity becomes unprofitable in a narrow profit-and-loss sense.
A roughly similar case can be made, I think, for human institutions — a case that contrasts the fragility of rigid, single-purpose, centralized institutions to the adaptability of more flexible, multipurpose, decentralized social forms. As long as the task environment of an institution remains repetitive, stable, and predictable, a set of fixed routines may prove exceptionally efficient. In most economies and in human affairs generally, this is seldom the case, and such routines are likely to be counterproductive once the environment changes appreciably.” (-ll-, pp. 353-354) - “If the facts — that is, the behavior of living human beings — are recalcitrant to […] an experiment, the experimenter becomes annoyed and tries to alter the facts to fit the theory, which, in practice, means a kind of vivisection of societies until they become what the theory originally declared that the experiment should have caused them to be. (Isaiah Berlin, “On Political Judgment”)
- “Before a disaster strikes, all your preparation looks like waste. After a disaster strikes, it looks like you didn’t do enough. Every time.” (‘Coagulopath’, here)
- “The effort an interested party makes to put its case before the decisionmaker will be in proportion to the advantage to be gained from a favorable outcome multiplied by the probability of influencing the decision.” (Edward Banfeld, quote from Albert Otto Hirschman’s Exit, Voice and Loyalty, Harvard University Press)
- The argument to be presented [in this book] starts with the firm producing saleable outputs for customers; but it will be found to be largely — and, at times, principally — applicable to organizations (such as voluntary associations, trade unions, or political parties) that provide services to their members without direct monetary counterpart. The performance of a firm or an organization is assumed to be subject to deterioration for unspecified, random causes which are neither so compelling nor so durable as to prevent a return to previous performance levels, provided managers direct their attention and energy to that task. The deterioration in performance is reflected most typically and generally, that is, for both firms and other organizations, in an absolute or comparative deterioration of the quality of the product or service provided.1 Management then finds out about its failings via two alternative routes: (1) Some customers stop buying the firm’s products or some members leave the organization: this is the exit option. As a result, revenues drop, membership declines, and management is impelled to search for ways and means to correct whatever faults have led to exit. (2) The firm’s customers or the organization’s members express their dissatisfaction directly to management or to some other authority to which management is subordinate or through general protest addressed to anyone who cares to listen: this is the voice option.” (ibid.)
- “Voice has the function of alerting a firm or organization to its failings, but it must then give management, old or new, some time to respond to the pressures that have been brought to bear on it. […] In the case of any one particular firm or organization and its deterioration, either exit or voice will ordinarily have the role of the dominant reaction mode. The subsidiary mode is then likely to show up in such limited volume that it will never become destructive for the simple reason that, if deterioration proceeds, the job of destruction is accomplished single-handedly by the dominant mode. In the case of normally competitive business firms, for example, exit is clearly the dominant reaction to deterioration and voice is a badly underdeveloped mechanism; it is difficult to conceive of a situation in which there would be too much of it.” (-ll-)
- “The reluctance to exit in spite of disagreement with the organization of which one is a member is the hallmark of loyalist behavior. When loyalty is present exit abruptly changes character: the applauded rational behavior of the alert consumer shifting to a better buy becomes disgraceful defection, desertion, and treason. Loyalist behavior […] can be understood in terms of a generalized concept of penalty for exit. The penalty may be directly imposed, but in most cases it is internalized. The individual feels that leaving a certain group carries a high price with it, even though no specific sanction is imposed by the group. In both cases, the decision to remain a member and not to exit in the face of a superior alternative would thus appear to follow from a perfectly rational balancing of prospective private benefits against private costs.” (-ll-)
- “The preference that [an] individual ends up conveying to others is what I will call his public preference. It is distinct from his private preference, which is what he would express in the absence of social pressures. By definition, preference falsification is the selection of a public preference that differs from one’s private preference. […] It is public opinion, rather than private opinion, that undergirds political power. Private opinion may be highly unfavorable to a regime, policy, or institution without generating a public outcry for change. The communist regimes of Eastern Europe survived for decades even though they were widely despised. They remained in power as long as public opinion remained overwhelmingly in their favor, collapsing instantly when street crowds mustered the courage to rise against them.” (Timur Kuran, Private Truths, Public Lies, Harvard University Press).
- “Even in democratic societies, where the right to think, speak, and act freely enjoys official protection, and where tolerance is a prized virtue, unorthodox views can evoke enormous hostility. In the United States, for instance, to defend the sterilization of poor women or the legalization of importing ivory would be to raise doubts about one’s civility and morality, if not one’s sanity. […] strictly enforced, freedom of speech does not insulate people’s reputations from their expressed opinions. Precisely because people who express different opinions do get treated differently, individuals normally tailor their expressions to the prevailing social pressures. Their adjustments vary greatly in social impact. At one extreme are harmless, and possibly beneficial, acts of politeness, as when one tells a friend wearing a garish shirt that he has good taste. At the other are acts of spinelessness on issues of general concern, as when a politician endorses a protectionist measure that he recognizes as harmful to most of his constituents. The pressures generating such acts of insincerity need not originate from the government. Preference falsification is compatible with all political systems, from the most unyielding dictatorship to the most libertarian democracy.” (-ll-)
- “How will the individual choose what preference to convey? Three distinct considerations may enter his calculations: the satisfaction he is likely to obtain from society’s decision, the rewards and punishments associated with his chosen preference, and finally, the benefits he derives from truthful self-expression. If large numbers of individuals are expressing preferences on the issue, the individual’s capacity to influence the collective decision is likely to be negligible. In this case he will consider society’s decision to be essentially fixed, basing his own preference declaration only on the second and third considerations. Ordinarily, these offer a tradeoff between the benefits of self-expression and those of being perceived as someone with the right preference. Where the latter benefits dominate, our individual will engage in preference falsification.” (-ll-)
- “Issues of political importance present individuals with tradeoffs between outer and inner peace. Frequently, therefore, these matters force people to choose between their reputations and their individualities. There are contexts, of course, in which such tradeoffs are dealt with by remaining silent […]. Silence has two possible advantages and two disadvantages. On the positive side, it spares one the penalty of taking a position offensive to others, and it may lessen the inner cost of preference falsification. On the negative side, one gives up available rewards, and one’s private preference remains hidden. On some controversial issues, the sum of these various payoffs may exceed the net payoff to expressing some preference. Certain contexts present yet another option: abandoning the decision-making group that is presenting one with difficult choices. This option, “exit,” is sometimes exercised by group members unhappy with the way things are going, yet powerless to effect change. […] For all practical purposes, exit is not always a viable option. Often our choices are limited to expressing some preference or remaining silent.” (-ll-)
- “In a polarized political environment, individuals may not be able to position themselves on neutral ground even if they try. Each side may perceive a declaration of neutrality or moderation as collaboration with the enemy, leaving moderates exposed to attacks from two directions at once.” (-ll-)
- “[C]ontinuities [in societal/organizational structures] arise from obstacles to implementing change. One impediment, explored in Albert Hirschman’s Exit, Voice, and Loyalty, consists of individual decisions to “exit”: menacing elements of the status quo survive as people capable of making a difference opt to abandon the relevant decision-making group.2 Another such mechanism lies at the heart of Mancur Olson’s book on patterns of economic growth, The Rise and Decline of Nations: unpopular choices persist because the many who support change are less well organized than the few who are opposed.3 Here I argue that preference falsification is a complementary, yet more elementary, reason for the persistence of unwanted social choices. Hirschman’s exit is a form of public identification with change, as is his “voice,” which he defines as vocal protest. Preference falsification is often cheaper than escape, and it avoids the risks inherent in public protest. Frequently, therefore, it is the initial response of people who become disenchanted with the status quo.” (-ll-)
- “Public opinion can be divided yet heavily favor the status quo, with the few public dissenters being treated as deviants, opportunists, or villains. If millions have misgivings about a policy but only hundreds will speak up, one can sensibly infer that discussion on the policy is not free.” (-ll-)
- “…heuristics are most likely to be used under one or more of the following conditions: we do not have time to think carefully about an issue; we are too overloaded with information to process it fully; the issues at stake are unimportant; we have little other information on which to base a decision; and a given heuristic comes quickly to mind.” (-ll-)
- “What most people outside of analytics often fail to appreciate is that to generate what is seen, there’s a complex machinery that is unseen. For every dashboard and insight that a data analyst generates and for each predictive model developed by a data scientist, there are data pipelines working behind the scenes. It’s not uncommon for a single dashboard, or even a single metric, to be derived from data originating in multiple source systems. In addition, data pipelines do more than just extract data from sources and load them into simple database tables or flat files for analysts to use. Raw data is refined along the way to clean, structure, normalize, combine, aggregate, and at times anonymize or otherwise secure it. […] In addition, pipelines are not just built — they are monitored, maintained, and extended. Data engineers are tasked with not just delivering data once, but building pipelines and supporting infrastructure that deliver and process it reliably, securely, and on time.” (Data Pipelines Pocket Reference, James Densmore, O’Reilly Media)
- “The S in IoT stands for security.” (‘Windowsteak’, here)
- “Do not seek for information of which you cannot make use.” (Anna C. Brackett)
Quotes
i. “‘Intuition’ comes first. Reasoning comes second.” (Llewelyn & Doorn, Clinical Psychology: A Very Short Introduction, Oxford University Press)
ii. “We tend to cope with difficulties in ways that are familiar to us — acting in ways that were helpful to us in the past, even if these ways are now ineffective or destructive.” (-ll-)
iii. “We all thrive when given attention, and being encouraged and praised is more effective at changing our behaviour than being punished. The best way to increase the frequency of a behaviour is to reward it.” (-ll-)
iv. “You can’t make people change if they don’t want to, but you can support and encourage them to make changes.” (-ll-)
v. “You shall know a word by the company it keeps” (John Rupert Firth, as quoted in Thierry Poibeau’s Machine Translation, MIT Press).
vi. “The basic narrative of sedentism and agriculture has long survived the mythology that originally supplied its charter. From Thomas Hobbes to John Locke to Giambattista Vico to Lewis Henry Morgan to Friedrich Engels to Herbert Spencer to Oswald Spengler to social Darwinist accounts of social evolution in general, the sequence of progress from hunting and gathering to nomadism to agriculture (and from band to village to town to city) was settled doctrine. Such views nearly mimicked Julius Caesar’s evolutionary scheme from households to kindreds to tribes to peoples to the state (a people living under laws), wherein Rome was the apex […]. Though they vary in details, such accounts record the march of civilization conveyed by most pedagogical routines and imprinted on the brains of schoolgirls and schoolboys throughout the world. The move from one mode of subsistence to the next is seen as sharp and definitive. No one, once shown the techniques of agriculture, would dream of remaining a nomad or forager. Each step is presumed to represent an epoch-making leap in mankind’s well-being: more leisure, better nutrition, longer life expectancy, and, at long last, a settled life that promoted the household arts and the development of civilization. Dislodging this narrative from the world’s imagination is well nigh impossible; the twelve-step recovery program required to accomplish that beggars the imagination. I nevertheless make a small start here. It turns out that the greater part of what we might call the standard narrative has had to be abandoned once confronted with accumulating archaeological evidence.” (James C. Scott, Against the Grain, Yale University Press)
vii. “Thanks to hominids, much of the world’s flora and fauna consist of fire-adapted species (pyrophytes) that have been encouraged by burning. The effects of anthropogenic fire are so massive that they might be judged, in an evenhanded account of the human impact on the natural world, to overwhelm crop and livestock domestications.” (-ll-)
viii. “Most discussions of plant domestication and permanent settlement […] assume without further ado that early peoples could not wait to settle down in one spot. Such an assumption is an unwarranted reading back from the standard discourses of agrarian states stigmatizing mobile populations as primitive. […] Nor should the terms “pastoralist,” “agriculturalist,” “hunter,” or “forager,” at least in their essentialist meanings, be taken for granted. They are better understood as defining a spectrum of subsistence activities, not separate peoples […] A family or village whose crops had failed might turn wholly or in part to herding; pastoralists who had lost their flocks might turn to planting. Whole areas during a drought or wetter period might radically shift their subsistence strategy. To treat those engaged in these different activities as essentially different peoples inhabiting different life worlds is again to read back the much later stigmatization of pastoralists by agrarian states to an era where it makes no sense.” (-ll-)
ix. “Neither holy, nor Roman, nor an empire” (Voltaire, on the Holy Roman Empire, as quoted in Joachim Whaley’s The Holy Roman Empire: A Very Short Introduction, Oxford University Press)
x. “We don’t outgrow difficult conversations or get promoted past them. The best workplaces and most effective organizations have them. The family down the street that everyone thinks is perfect has them. Loving couples and lifelong friends have them. In fact, we can make a reasonable argument that engaging (well) in difficult conversations is a sign of health in a relationship. Relationships that deal productively with the inevitable stresses of life are more durable; people who are willing and able to “stick through the hard parts” emerge with a stronger sense of trust in each other and the relationship, because now they have a track record of having worked through something hard and seen that the relationship survived.” (Stone et al., Difficult Conversations, Penguin Publishing Group)
xi. “[D]ifficult conversations are almost never about getting the facts right. They are about conflicting perceptions, interpretations, and values. […] They are not about what is true, they are about what is important. […] Interpretations and judgments are important to explore. In contrast, the quest to determine who is right and who is wrong is a dead end. […] When competent, sensible people do something stupid, the smartest move is to try to figure out, first, what kept them from seeing it coming and, second, how to prevent the problem from happening again. Talking about blame distracts us from exploring why things went wrong and how we might correct them going forward.” (-ll-)
xii. “[W]e each have different stories about what is going on in the world. […] In the normal course of things, we don’t notice the ways in which our story of the world is different from other people’s. But difficult conversations arise at precisely those points where important parts of our story collide with another person’s story. We assume the collision is because of how the other person is; they assume it’s because of how we are. But really the collision is a result of our stories simply being different, with neither of us realizing it. […] To get anywhere in a disagreement, we need to understand the other person’s story well enough to see how their conclusions make sense within it. And we need to help them understand the story in which our conclusions make sense. Understanding each other’s stories from the inside won’t necessarily “solve” the problem, but […] it’s an essential first step.” (-ll-)
xiii. “I am really nervous about the word “deserve”. In some cosmic sense nobody “deserves” anything – try to tell the universe you don’t deserve to grow old and die, then watch it laugh at [you] as you die anyway.” (Scott Alexander)
xiv. “How we spend our days is, of course, how we spend our lives.” (Annie Dillard)
xv. “If you do not change direction, you may end up where you are heading.” (Lao Tzu)
xvi. “The smart way to keep people passive and obedient is to strictly limit the spectrum of acceptable opinion, but allow very lively debate within that spectrum.” (Chomsky)
xvii. “If we don’t believe in free expression for people we despise, we don’t believe in it at all.” (-ll-)
xviii. “I weigh the man, not his title; ’tis not the king’s stamp can make the metal better.” (William Wycherley)
xix. “Money is the fruit of evil as often as the root of it.” (Henry Fielding)
xx. “To whom nothing is given, of him can nothing be required.” (-ll-)
Algorithms to live by…
“…algorithms are not confined to mathematics alone. When you cook bread from a recipe, you’re following an algorithm. When you knit a sweater from a pattern, you’re following an algorithm. When you put a sharp edge on a piece of flint by executing a precise sequence of strikes with the end of an antler—a key step in making fine stone tools—you’re following an algorithm. Algorithms have been a part of human technology ever since the Stone Age.
* * *
In this book, we explore the idea of human algorithm design—searching for better solutions to the challenges people encounter every day. Applying the lens of computer science to everyday life has consequences at many scales. Most immediately, it offers us practical, concrete suggestions for how to solve specific problems. Optimal stopping tells us when to look and when to leap. The explore/exploit tradeoff tells us how to find the balance between trying new things and enjoying our favorites. Sorting theory tells us how (and whether) to arrange our offices. Caching theory tells us how to fill our closets. Scheduling theory tells us how to fill our time. At the next level, computer science gives us a vocabulary for understanding the deeper principles at play in each of these domains. As Carl Sagan put it, “Science is a way of thinking much more than it is a body of knowledge.” Even in cases where life is too messy for us to expect a strict numerical analysis or a ready answer, using intuitions and concepts honed on the simpler forms of these problems offers us a way to understand the key issues and make progress. […] tackling real-world tasks requires being comfortable with chance, trading off time with accuracy, and using approximations.”
…
I recall Zach Weinersmith recommending the book, and I seem to recall him mentioning when he did so that he’d put off reading it ‘because it sounded like a self-help book’ (paraphrasing). I’m not actually sure how to categorize it but I do know that I really enjoyed it; I gave it five stars on goodreads and added it to my list of favourite books.
The book covers a variety of decision problems and tradeoffs which people face in their every day lives, as well as strategies for how to approach such problems and identify good solutions (if they exist). The explore/exploit tradeoff so often implicitly present (e.g.: ‘when to look for a new restaurant, vs. picking one you are already familiar with’, or perhaps: ‘when to spend time with friends you already know, vs. spending time trying to find new (/better?) friends?’), optimal stopping rules (‘at which point do you stop looking for a romantic partner and decide that ‘this one is the one’?’ – this is perhaps a well-known problem with a well-known solution, but had you considered that you might use the same analytical framework for questions such as: ‘when to stop looking for a better parking spot and just accept that this one is probably the best one you’ll be able to find?’?), sorting problems (good and bad ways of sorting, why sort, when is sorting even necessary/required?, etc.), scheduling theory (how to handle task management in a good way, so that you optimize over a given constraint set – some examples from this part are included in the quotes below), satisficing vs optimizing (heuristics, ‘when less is more’, etc.), etc. The book is mainly a computer science book, but it is also to some extent an implicitly interdisciplinary work covering material from a variety of other areas such as statistics, game theory, behavioral economics and psychology. There is a major focus throughout on providing insights which are actionable and can actually be used by the reader, e.g. through the translation of identified solutions to heuristics which might be applied in every day life. The book is more pop-science-like than any book I’d have liked to read 10 years ago, and there are too many personal anecdotes for my taste included, but in some sense this never felt like a major issue while I was reading; a lot of interesting ideas and topics are covered, and the amount of fluff is within acceptable limits – a related point is also that the ‘fluff’ is also part of what makes the book relevant, because the authors really focus on tradeoffs and problems which really are highly relevant to some potentially key aspects of most people’s lives, including their own.
Below I have added some sample quotes from the book. If you like the quotes you’ll like the book, it’s full of this kind of stuff. I definitely recommend it to anyone remotely interested in decision theory and related topics.
…
“…one of the deepest truths of machine learning is that, in fact, it’s not always better to use a more complex model, one that takes a greater number of factors into account. And the issue is not just that the extra factors might offer diminishing returns—performing better than a simpler model, but not enough to justify the added complexity. Rather, they might make our predictions dramatically worse. […] overfitting poses a danger every time we’re dealing with noise or mismeasurement – and we almost always are. […] Many prediction algorithms […] start out by searching for the single most important factor rather than jumping to a multi-factor model. Only after finding that first factor do they look for the next most important factor to add to the model, then the next, and so on. Their models can therefore be kept from becoming overly complex simply by stopping the process short, before overfitting has had a chance to creep in. […] This kind of setup — where more time means more complexity — characterizes a lot of human endeavors. Giving yourself more time to decide about something does not necessarily mean that you’ll make a better decision. But it does guarantee that you’ll end up considering more factors, more hypotheticals, more pros and cons, and thus risk overfitting. […] The effectiveness of regularization in all kinds of machine-learning tasks suggests that we can make better decisions by deliberately thinking and doing less. If the factors we come up with first are likely to be the most important ones, then beyond a certain point thinking more about a problem is not only going to be a waste of time and effort — it will lead us to worse solutions. […] sometimes it’s not a matter of choosing between being rational and going with our first instinct. Going with our first instinct can be the rational solution. The more complex, unstable, and uncertain the decision, the more rational an approach that is.” (…for more on these topics I recommend Gigerenzer)
“If you’re concerned with minimizing maximum lateness, then the best strategy is to start with the task due soonest and work your way toward the task due last. This strategy, known as Earliest Due Date, is fairly intuitive. […] Sometimes due dates aren’t our primary concern and we just want to get stuff done: as much stuff, as quickly as possible. It turns out that translating this seemingly simple desire into an explicit scheduling metric is harder than it sounds. One approach is to take an outsider’s perspective. We’ve noted that in single-machine scheduling, nothing we do can change how long it will take us to finish all of our tasks — but if each task, for instance, represents a waiting client, then there is a way to take up as little of their collective time as possible. Imagine starting on Monday morning with a four-day project and a one-day project on your agenda. If you deliver the bigger project on Thursday afternoon (4 days elapsed) and then the small one on Friday afternoon (5 days elapsed), the clients will have waited a total of 4 + 5 = 9 days. If you reverse the order, however, you can finish the small project on Monday and the big one on Friday, with the clients waiting a total of only 1 + 5 = 6 days. It’s a full workweek for you either way, but now you’ve saved your clients three days of their combined time. Scheduling theorists call this metric the “sum of completion times.” Minimizing the sum of completion times leads to a very simple optimal algorithm called Shortest Processing Time: always do the quickest task you can. Even if you don’t have impatient clients hanging on every job, Shortest Processing Time gets things done.”
“Of course, not all unfinished business is created equal. […] In scheduling, this difference of importance is captured in a variable known as weight. […] The optimal strategy for [minimizing weighted completion time] is a simple modification of Shortest Processing Time: divide the weight of each task by how long it will take to finish, and then work in order from the highest resulting importance-per-unit-time [..] to the lowest. […] this strategy … offers a nice rule of thumb: only prioritize a task that takes twice as long if it’s twice as important.”
“So far we have considered only factors that make scheduling harder. But there is one twist that can make it easier: being able to stop one task partway through and switch to another. This property, “preemption,” turns out to change the game dramatically. Minimizing maximum lateness … or the sum of completion times … both cross the line into intractability if some tasks can’t be started until a particular time. But they return to having efficient solutions once preemption is allowed. In both cases, the classic strategies — Earliest Due Date and Shortest Processing Time, respectively — remain the best, with a fairly straightforward modification. When a task’s starting time comes, compare that task to the one currently under way. If you’re working by Earliest Due Date and the new task is due even sooner than the current one, switch gears; otherwise stay the course. Likewise, if you’re working by Shortest Processing Time, and the new task can be finished faster than the current one, pause to take care of it first; otherwise, continue with what you were doing.”
“…even if you don’t know when tasks will begin, Earliest Due Date and Shortest Processing Time are still optimal strategies, able to guarantee you (on average) the best possible performance in the face of uncertainty. If assignments get tossed on your desk at unpredictable moments, the optimal strategy for minimizing maximum lateness is still the preemptive version of Earliest Due Date—switching to the job that just came up if it’s due sooner than the one you’re currently doing, and otherwise ignoring it. Similarly, the preemptive version of Shortest Processing Time—compare the time left to finish the current task to the time it would take to complete the new one—is still optimal for minimizing the sum of completion times. In fact, the weighted version of Shortest Processing Time is a pretty good candidate for best general-purpose scheduling strategy in the face of uncertainty. It offers a simple prescription for time management: each time a new piece of work comes in, divide its importance by the amount of time it will take to complete. If that figure is higher than for the task you’re currently doing, switch to the new one; otherwise stick with the current task. This algorithm is the closest thing that scheduling theory has to a skeleton key or Swiss Army knife, the optimal strategy not just for one flavor of problem but for many. Under certain assumptions it minimizes not just the sum of weighted completion times, as we might expect, but also the sum of the weights of the late jobs and the sum of the weighted lateness of those jobs.”
“…preemption isn’t free. Every time you switch tasks, you pay a price, known in computer science as a context switch. When a computer processor shifts its attention away from a given program, there’s always a certain amount of necessary overhead. […] It’s metawork. Every context switch is wasted time. Humans clearly have context-switching costs too. […] Part of what makes real-time scheduling so complex and interesting is that it is fundamentally a negotiation between two principles that aren’t fully compatible. These two principles are called responsiveness and throughput: how quickly you can respond to things, and how much you can get done overall. […] Establishing a minimum amount of time to spend on any one task helps to prevent a commitment to responsiveness from obliterating throughput […] The moral is that you should try to stay on a single task as long as possible without decreasing your responsiveness below the minimum acceptable limit. Decide how responsive you need to be — and then, if you want to get things done, be no more responsive than that. If you find yourself doing a lot of context switching because you’re tackling a heterogeneous collection of short tasks, you can also employ another idea from computer science: “interrupt coalescing.” If you have five credit card bills, for instance, don’t pay them as they arrive; take care of them all in one go when the fifth bill comes.”
Shock waves and gamma-ray bursts from neutron star mergers – Andrei Beloborodov
Some links related to stuff discussed in the lecture/talk:
GW170817.
Superluminal motion of a relativistic jet in the neutron starmerger GW170817 (Mooley et al., 2018).
GRB 170817A Associated with GW170817: Multi-frequency Observations and Modeling of Prompt Gamma-ray Emission (Pozanenko et al., 2018).
Lorentz factor.
Gamma-ray burst progenitors.
Kilonova.
ResearchGate download link: A First-principle Simulation of Blast-wave Emergence at the Photosphere of a Neutron Star Merger (Lundman & Beloborodov, 2020).
Adiabatic index.
Shock waves in astrophysics.
Diffusive Shock Acceleration: the Fermi Mechanism.
Inverse Compton scattering.
Words
Amaurosis. Metanoia. Adit. Scansion. Gavage. Psephology. Sphaleron. Axonotmesis. Galena. Pingo. Girdling. Snag (ecology). Apophenia. Cenote. Neurotmesis. Acerose. Perseverant. Elapid. Aorist. Kana.
Intaglio. Hiragana. Palinal. Cathemerality. Calque. Numinous. Geas. Afforestation. Crumhorn. Senicide. Catenane. Extispicy/haruspex. Cataplerosis. Ophiolite. Diglossia. Hagiographer. Stylometry. Ossifrage. Pleuston/Neuston. Praline.
Saponification. Culet. Myiasis. Epithalamium. Thigmonasty. Stultiloquy. Thigmotropism. Aerospike. Calabash. Pandanus. Dumbwaiter. Doula. Hypocaust. Cynophobia. Flashover. Backdraft. Pyrolysis. Slat. Phugoid. Toxophily.
Irredentism. Crutching. Threnody. Petroglyph. Protologism. Aileron. Bunding. Phylactery. Guyot. Coupure. Barbette. Apophasis. Fissiparous. Marl. Syrinx. Bocage. Camouflet. Mulesing. Trypophobia. Berm.
James Simons interview
James Simons. Differential geometry. Minimal varieties in riemannian manifolds. Shiing-Shen Chern. Characteristic Forms and Geometric Invariants. Renaissance Technologies.
“That’s really what’s great about basic science and in this case mathematics, I mean, I didn’t know any physics. It didn’t occur to me that this material, that Chern and I had developed would find use somewhere else altogether. This happens in basic science all the time that one guy’s discovery leads to someone else’s invention and leads to another guy’s machine or whatever it is. Basic science is the seed corn of our knowledge of the world. …I loved the subject, but I liked it for itself, I wasn’t thinking of applications. […] the government’s not doing such a good job at supporting basic science and so there’s a role for philanthropy, an increasingly important role for philanthropy.”
“My algorithm has always been: You put smart people together, you give them a lot of freedom, create an atmosphere where everyone talks to everyone else. They’re not hiding in the corner with their own little thing. They talk to everybody else. And you provide the best infrastructure. The best computers and so on that people can work with and make everyone partners.”
“We don’t have enough teachers of mathematics who know it, who know the subject … and that’s for a simple reason: 30-40 years ago, if you knew some mathematics, enough to teach in let’s say high school, there weren’t a million other things you could do with that knowledge. Oh yeah, maybe you could become a professor, but let’s suppose you’re not quite at that level but you’re good at math and so on.. Being a math teacher was a nice job. But today if you know that much mathematics, you can get a job at Google, you can get a job at IBM, you can get a job in Goldman Sachs, I mean there’s plenty of opportunities that are going to pay more than being a high school teacher. There weren’t so many when I was going to high school … so the quality of high school teachers in math has declined, simply because if you know enough to teach in high school you know enough to work for Google…”
Recent Comments
Sabra Zaraa on Cost-effectiveness analysis in… adityaguharoy on Combinatorics (I) therookswinger on Magnus Carlsen playing bullet… Stefan on Quotes US on Quotes Goodreads Quotes
Usfromdk’s quotes
"Happiness and its anticipation are […] proximate mechanisms that lead us to perform and repeat acts that in the environments of history, at least, would have led to greater reproductive success." (Richard D. Alexander)Statcounter
